Review – SSD Sabrent Rocket 4 Plus-G 2TB – The First Gen 4 drive optimized for Direct Storage!
Today, we will be reviewing the Sabrent Rocket 4 Plus-G, a high-end NVMe drive from Sabrent’s product lineup. In this review, we will be testing the 2TB sample that Sabrent generously provided us with. While this lineup is not entirely new, it is an updated revision of the previously well-known “Rocket 4 Plus” lineup. The Sabrent Rocket 4 Plus-G is available in three capacities, including 1TB, 2TB (the drive we are testing), and 4TB. So far, an 8TB option is not yet available.
One unique aspect of this new lineup, beyond its physical differences, which we’ll examine shortly, is its launch focus. Sabrent equipped these new products with customized firmware that differs from the firmware in the first two variants of the Rocket 4 Plus. This lineup features the O? GO Firmware, which emphasizes Direct Storage, providing better speed and performance.
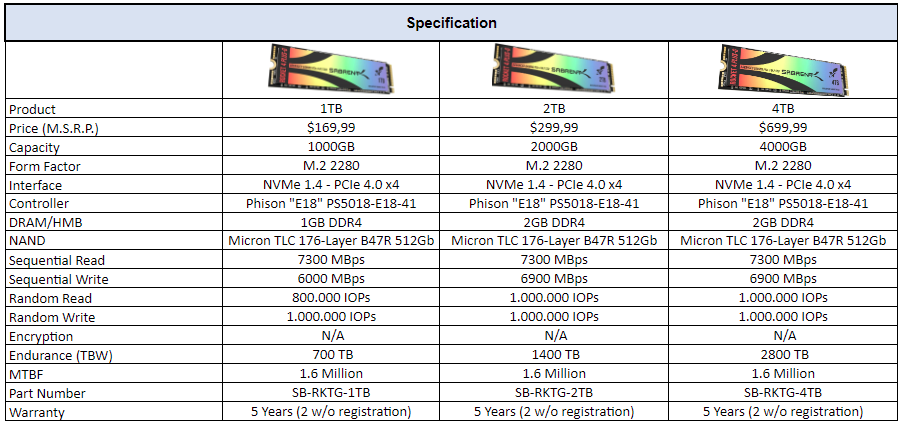
The Sabrent Rocket 4 Plus-G is available in M.2 form factor with a PCIe 4.0 x4 bus of 64Gbps, utilizing the NVMe 1.4 protocol. The lineup includes capacities ranging from 1TB to 4TB, omitting the 500GB and 8TB options. The MSRP prices for these SSDs are $169.99 for the 1TB unit, $299 for the 2TB unit, and $699 for the 4TB unit, which is a considerable increase compared to the previous Rocket 4 Plus units that cost $99 (1TB), $199 (2TB), and $599 (4TB), respectively. Throughout this review, we’ll explore whether the price difference is justifiable, not only in casual scenarios but also in more typical Direct Storage scenarios.
The drive’s default over provisioning size is 9.9%, which allow users to allocate, 1863GB of disk as L.B.A.
SSD Specifications
SSD’s Software Suite
Sabrent provides a range of useful programs for use with their SSDs, including options for reading SMART data and advanced features like firmware updates.
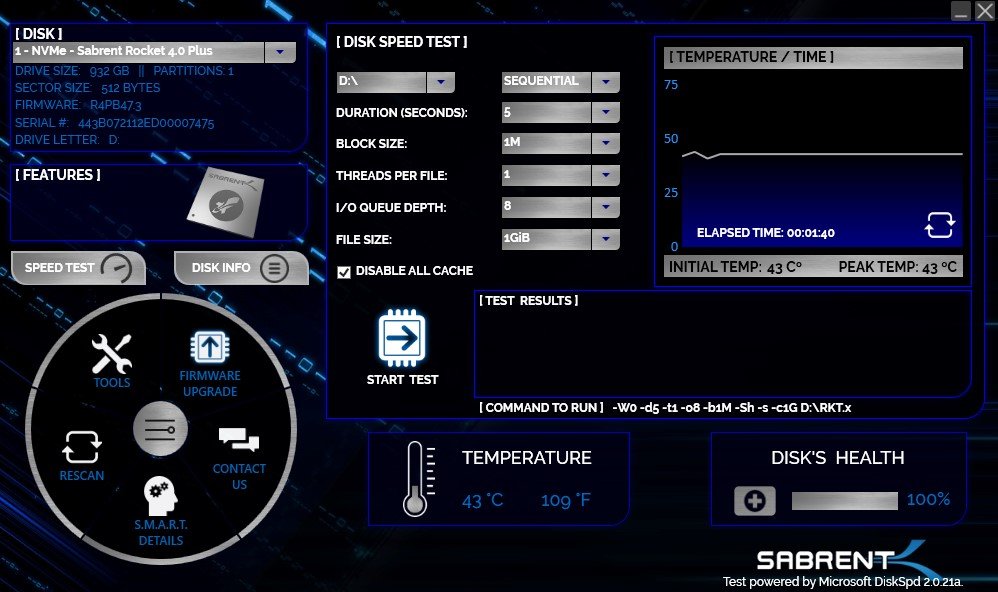
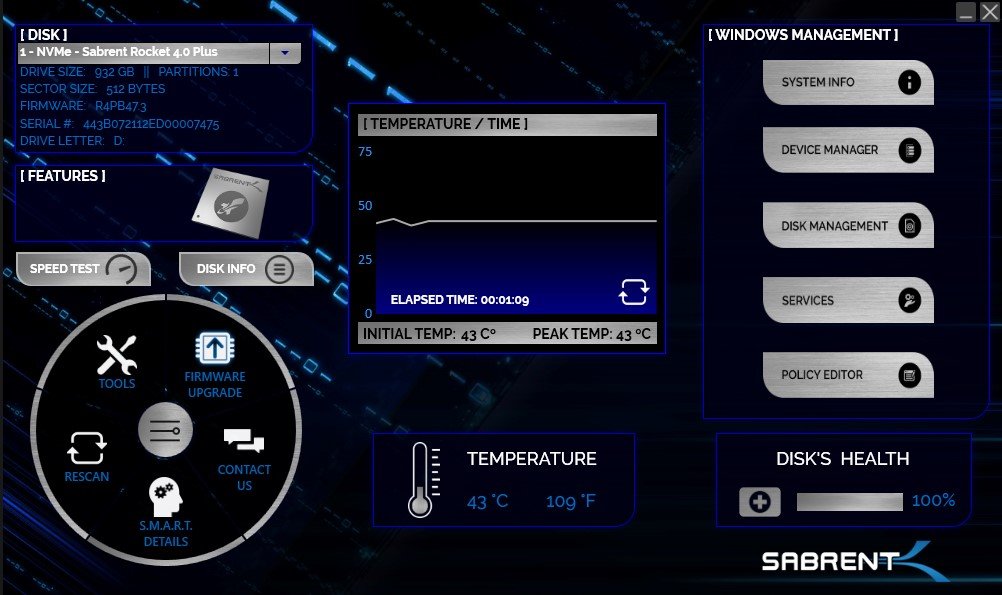
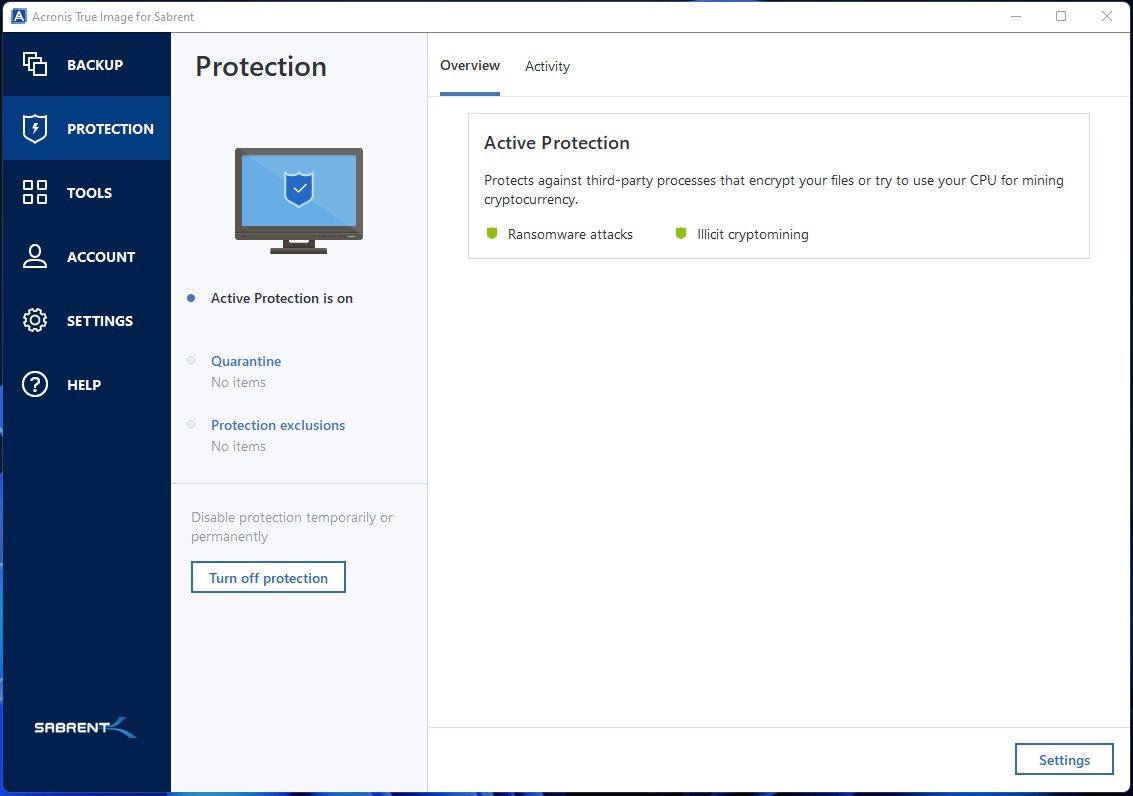
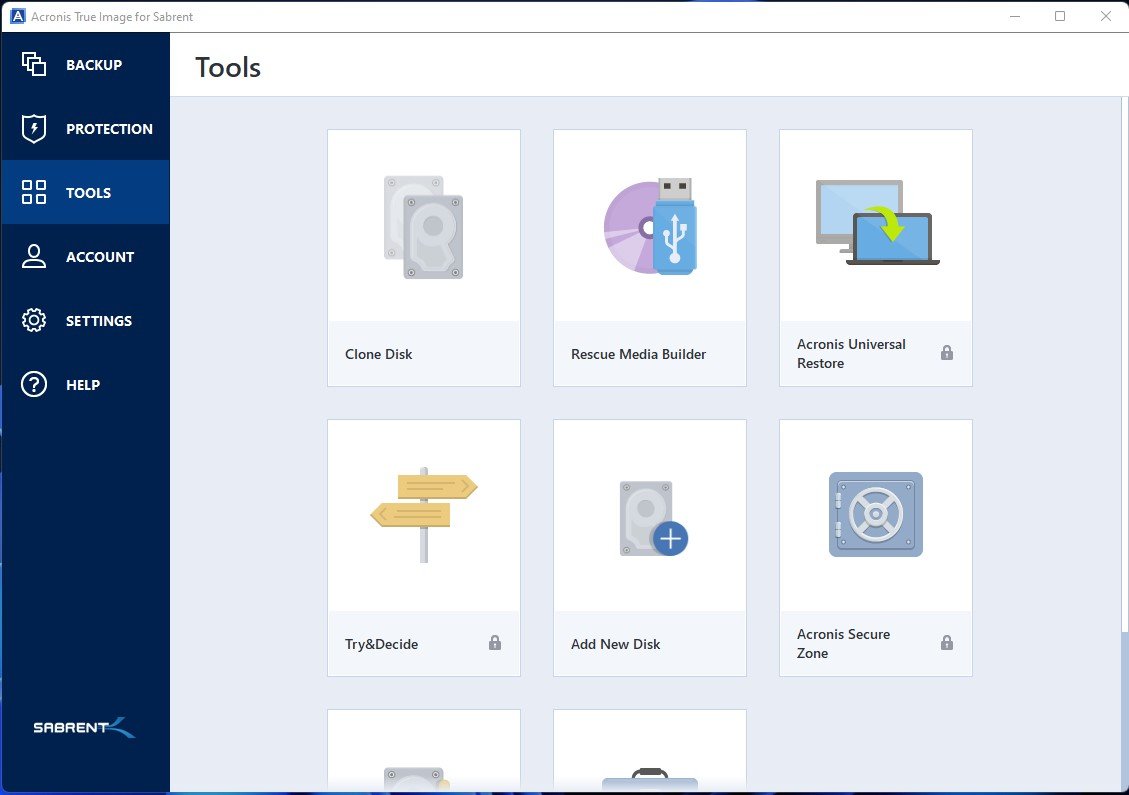
In addition to its software suite, Sabrent also includes a license for the “Acronis True Image” software, which provides various functionalities such as creating backup images, protection against Ransomware attacks, disk image recovery, among several other options.

Unboxing
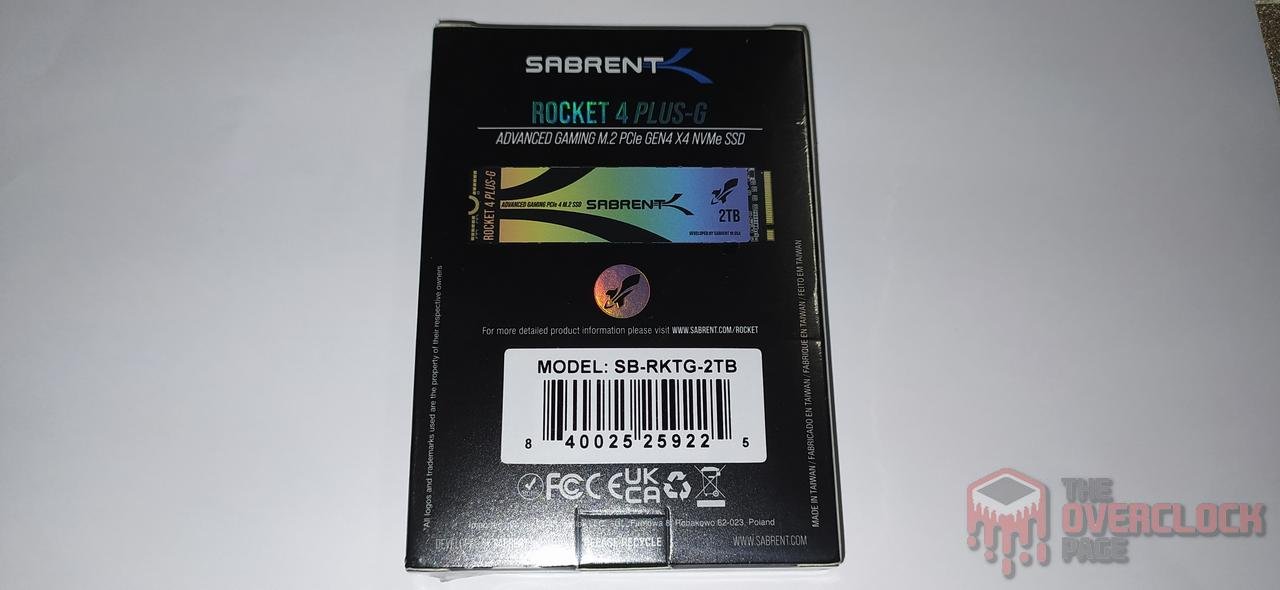
Our Sabrent Rocket 4 Plus-G 2TB unit arrived in a simple black packaging featuring an illustrative photo of the SSD on the front. The back of the packaging displayed a barcode and other product information, including the serial number.


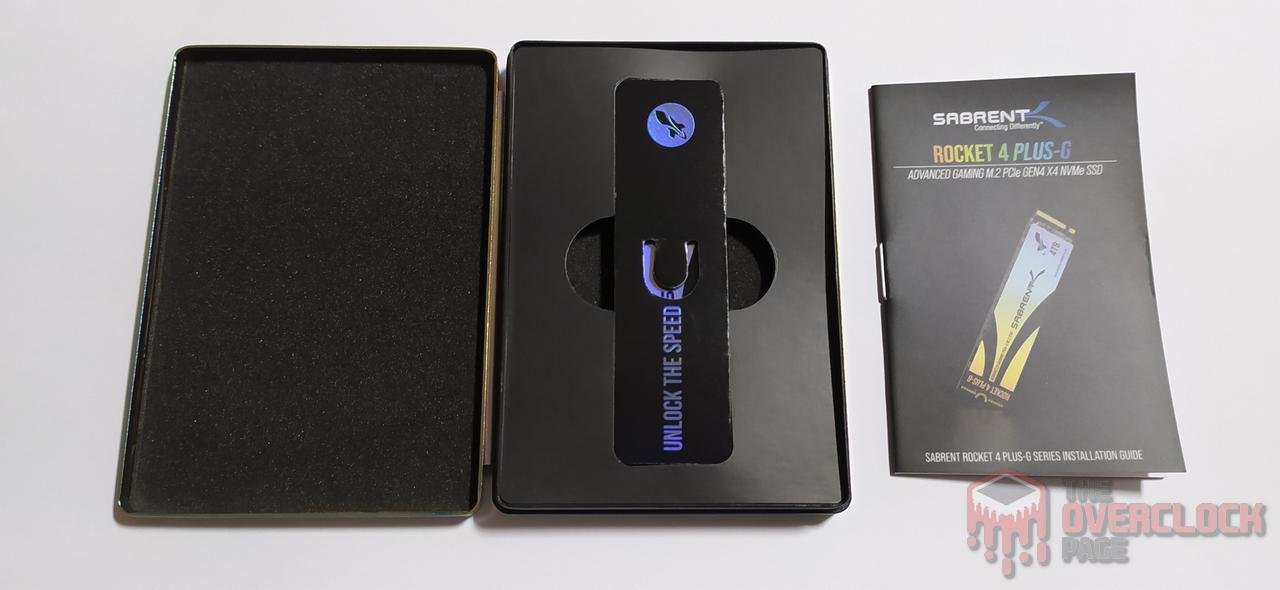
Inside the package, we found a beautiful metallic case in a vibrant purple color that looked almost like it had RGB lighting when viewed under certain lighting conditions. The SSD was well-protected with tape to prevent damage during transport, and an installation manual was included.
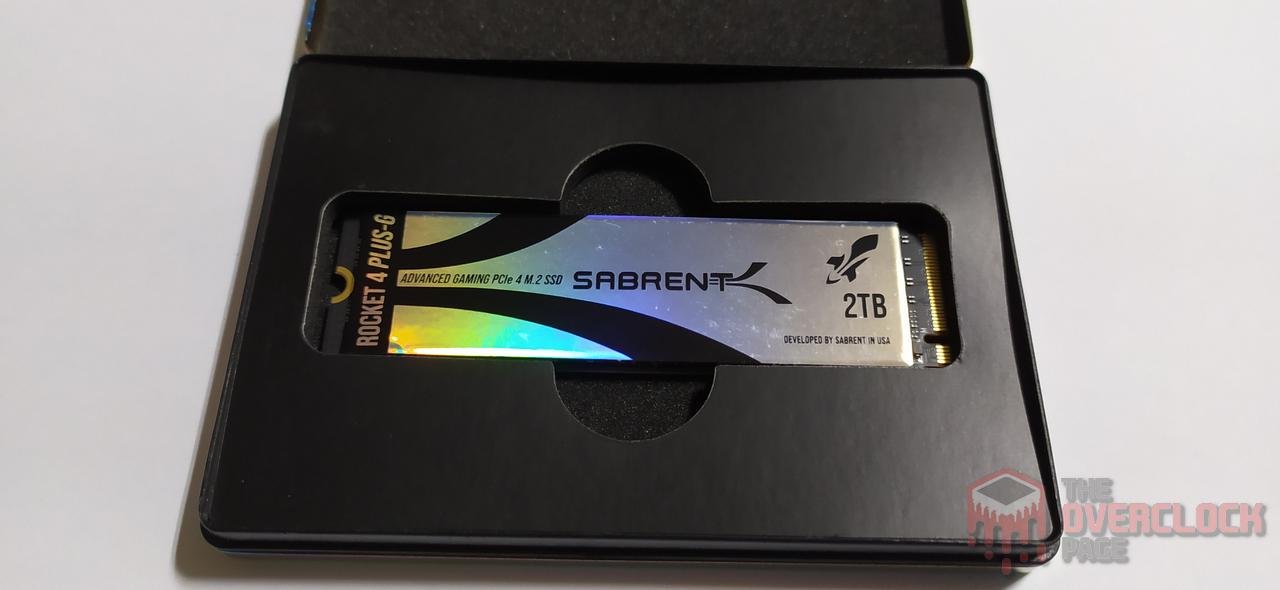
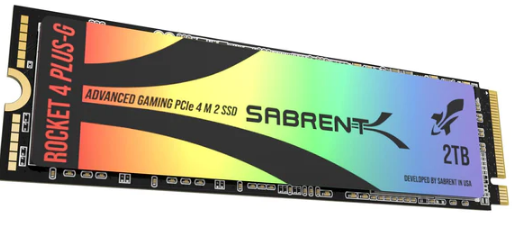
Next, we have some photos of the Sabrent Rocket 4 Plus-G 2TB unit, showing both the front and back sides of the SSD. One notable feature is the inclusion of a heat sink, which has a beautiful effect that creates various colors when light is shone on it. This adds an extra level of visual appeal to the product, which was lacking in its predecessor’s dull beige-colored heat sink.

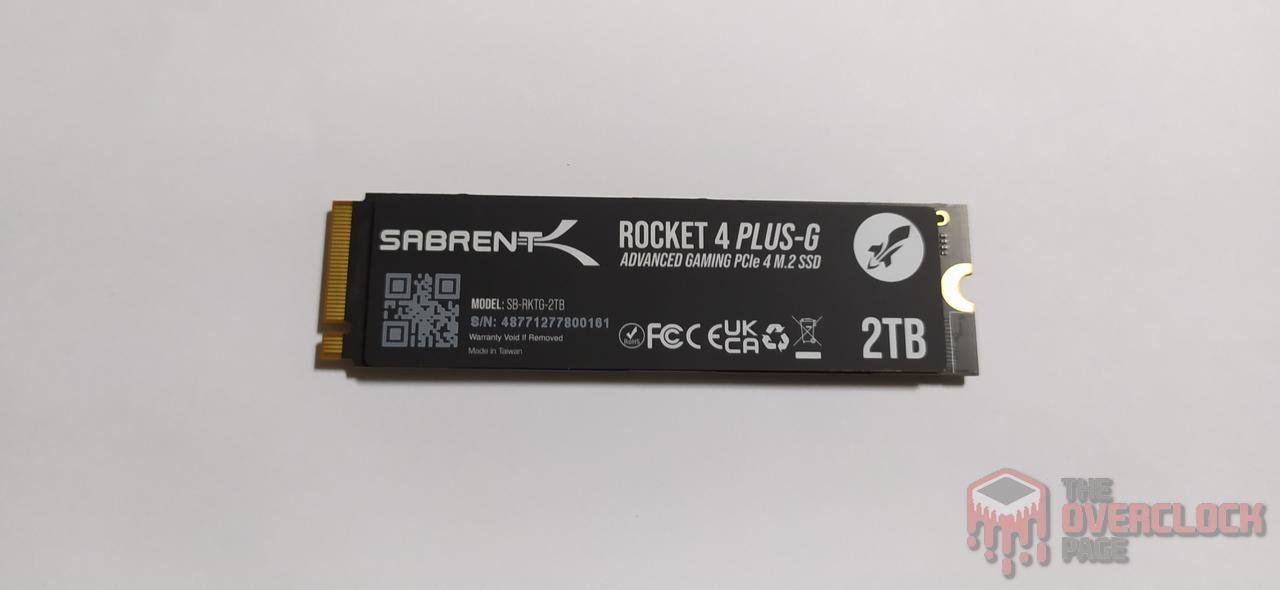
Sabrent also offers two versions of sturdy heat sinks that can be purchased separately for those interested. The first one was launched with the previous Rocket 4 Plus model we reviewed, and the second one has an identical design but with a new color scheme that looks amazing!


The heat sink is available for purchase separately for $29.99, but it’s often on promotion on sites like Amazon or Newegg for around $20 and there is also a bundle that includes the SSD with the heat sink. It’s worth noting that the heat sink is NOT compatible with the Playstation 5, but its height may cause compatibility issues if the M.2 slot is located under the graphics card.
On the front side of the SSD’s PCB, there are 7 main components including the controller, DRAM Cache, PMIC, and 4 NAND Flashs. On the back side, there are 4 NAND Flashs and 1 DRAM Cache chip


Controller
The SSD controller is responsible for all data management, over-provisioning, and garbage collection, among other background functions. And, of course, it ensures that the SSD performs well.
This SSD is equipped with a high-end Phison controller, the PS5018-E18-41. It is an ISA ARM 32-bit model with “5” Cortex® R5 cores (Penta-core) manufactured by TSMC using their 12nm process. The main cores run at a clock speed of 1 GHz. This controller is also used in other top-of-the-line SSDs, such as the Corsair MP600 HydroX, MP600 Pro, Galax Hall of Fame Extreme, the new Aorus Xtreme, and the Sabrent Rocket 4 Plus that we previously tested.
In this case, we are dealing with a triple-core controller, which means it has three main cores that manage the NANDs, with support for a technology called “CoXprocessors” – which is nothing more than another Dual-Core Cortex® R5 cores with a much lower frequency (usually 200~300 MHz) in order to perform simpler and predictive tasks. This allows the load on the 3 main cores to be reduced, as well as the electrical consumption and heat dissipation that can cause thermal throttling, which may be a problem since this SSD canpull almost 9W. One of these functions, for example, is to take care of repetitive code sections and firmware functions that the main cores would not need to do, in addition to managing data storage in the DRAM Cache, while the main cores are allocated for tasks such as Writing/Reading/Host.
This controller also supports up to 8 channels with a bus speed of up to 1600 MT/s, where each of these channels supports up to 4 Chip Enable commands, which allows this controller to communicate with up to 32 Dies simultaneously using the Interleaving technique.
DRAM Cache or H.M.B.
Every high-end SSD that aims to offer consistent high performance needs a buffer to store its mapping tables (Flash Translation Layer or Look-up table), which allows it to have better random performance and be more responsive.
As we can see in the image above, this SSD uses two ICs as DRAM Cache. The chip from SK Hynix model, “H5AN8G6NDJR-XNC,” is a DDR4 chip with 8Gb density (1 GB), totaling 2 GB, and operates at frequencies of up to 3,200 MT/s with latencies of CL-22-22-22. However, due to the limitation of the integrated IMC in the Phison E18 itself, this DRAM Cache chip operates at 2666 MT/s with lower latency as well, which is the maximum speed of its memory controller.
NAND Flash
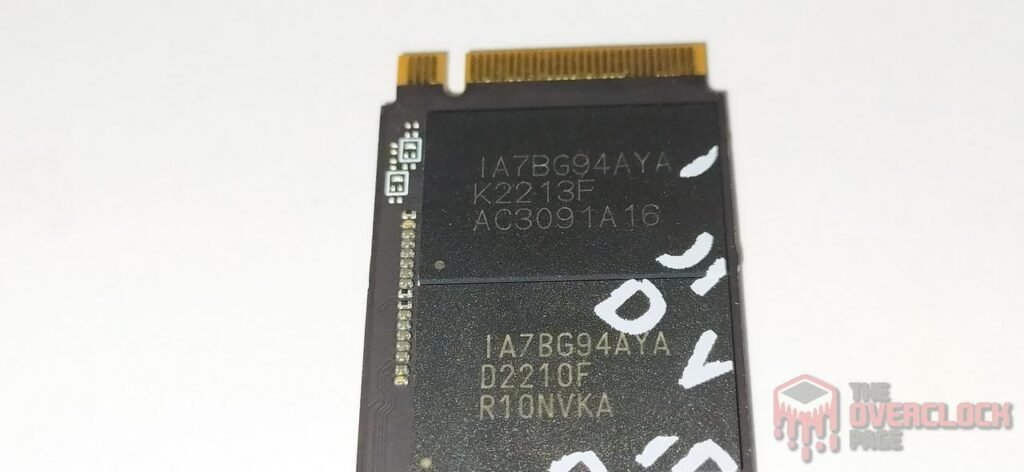
Regarding its NAND flash, the 2TB SSD has 8 NAND flash chips marked as “IA7GB94AYA“. These are NANDs from the American manufacturer Micron, each with 512Gb dies (64GiB) containing 176 layers of data, totaling 195 gate layers, resulting in an “Array Efficiency” of 90.3%.
Each NAND Flash in this SSD comprises four dies with a density of 512Gb, totaling 256 GiB per NAND Flash. Each die communicates with the controller at a bus speed of 1600 MT/s (800 MHz), which is already a notable difference from its Rocket 4 Plus predecessors that operated at a speed of 1200 MT/s (600 MHz). This extra speed can further boost the performance of these B47R dies, particularly in random operations.
Another key factor contributing to the incredible performance of this SSD is its high number of dies. With 32 dies in total, each with a capacity of 512Gb (64GB), this 2TB SSD is able to fully utilize the potential of the controller by communicating with up to 32 dies using interleaving techniques.
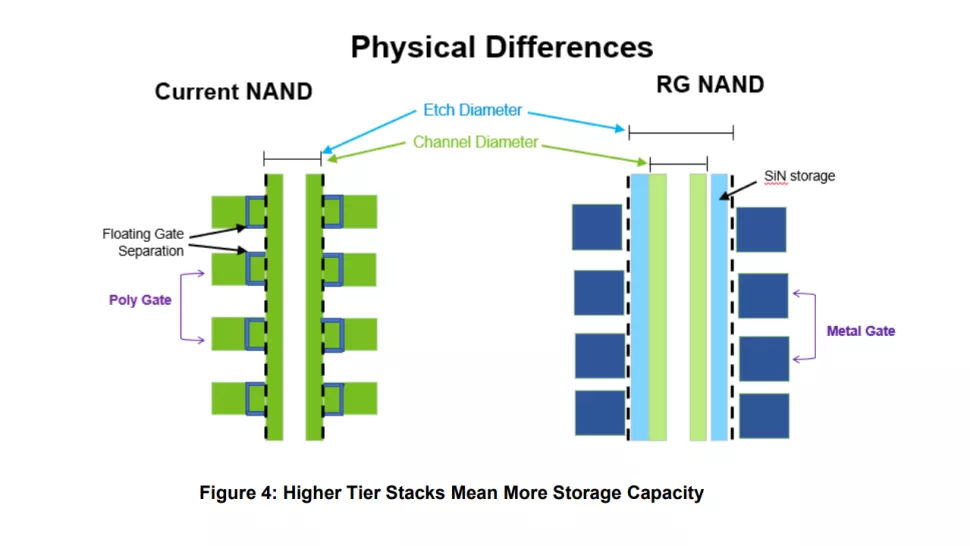
The dies in this SSD feature a new Micron topology known as Replacement Gate (R.G.), which combines Charge trap architecture with CuA (CMOS-under-Array) technology. This allows the Peripheral Circuitry to not occupy unnecessary space on the die, resulting in dies that are up to 30% smaller.
Another innovation is the significant reduction in the complexity of programming processes and overhead, thanks to the replacement of Silicon Gates that used to use Polysilicon, now using only metal. Additionally, they are using a technique called “Etching,” which involves drilling to place circuits and strings, thereby reducing resistance.
The new B47R NANDs achieve a 35% higher throughput compared to the previous generation’s B27B NANDs, which were 96-layer Micron NANDs released a few years ago.
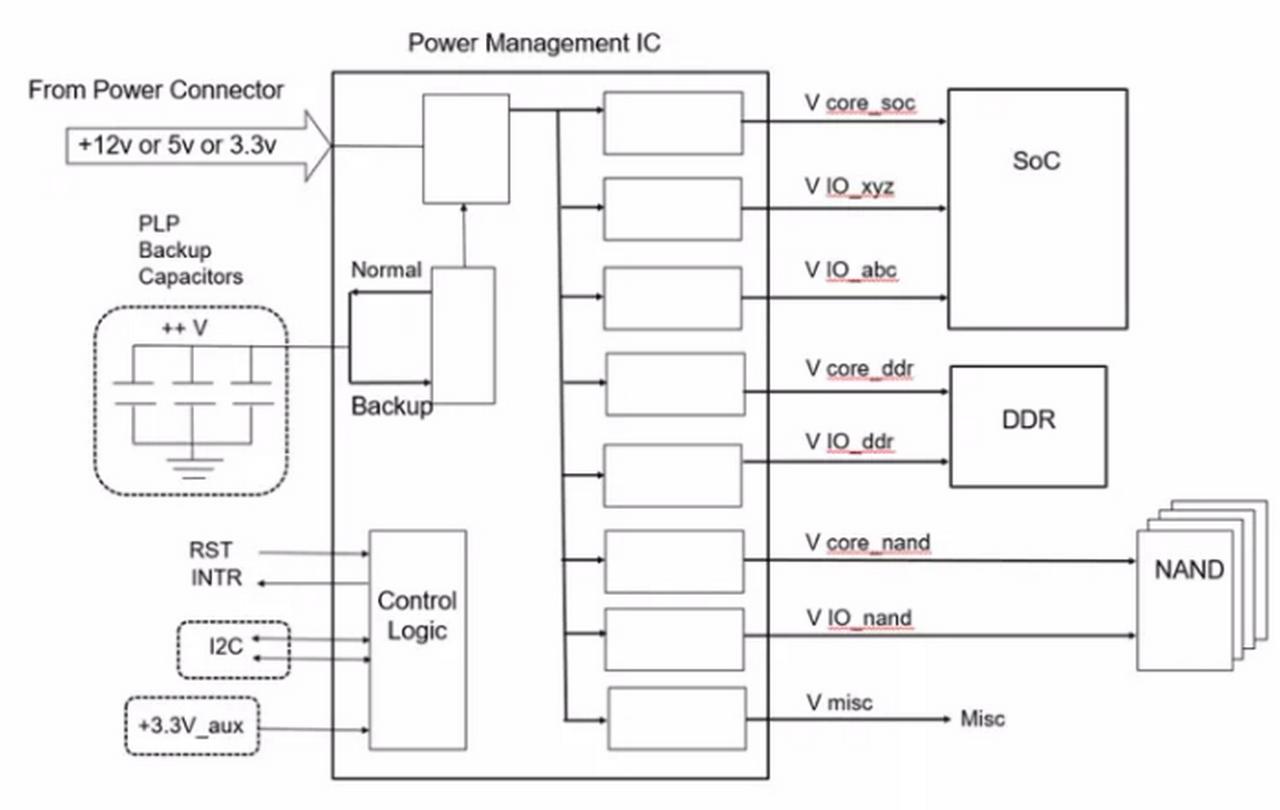
PMIC (Power Delivery)
Just like any electronic component, SSDs also have power consumption levels that can range from a few milliwatts up to nearly 10 W, which may approach the limit of some connectors or slots. The PMIC (Power Management IC) is responsible for managing all power and supplying power to other components within the SSD.

As we saw when mentioning its controller, this SSD has the traditional PS6108-22 IC that Phison usually uses as PMIC in its main SSDs.
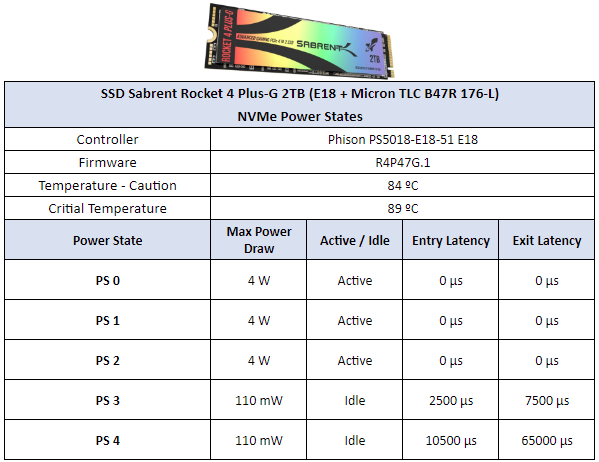
SSD Power States
As we always mention in power consumption analyses, in this section we will see more about the power states of this SSD.
Once again, it is worth noting that this SSD has 5 main power states, with slightly lower values than the Sabrent Rocket 4 Plus 4TB. Its PS0, the most active power state, has a value of 8.8W, although our testing shows that the SSD consumed over 9.4W.
Additionally, it has 2 main power states during idle, with approximate consumption values of 62mW and 44mW, respectively. The PS2 power state has a value of 5.2W, and in our test battery, we observed a consumption close to 4.6W.
CURIOSITIES ABOUT SABRENT ROCKET 4 PLUS-G 2TB AND DIRECT STORAGE
Similarly to how DRAM ICs on a memory module may vary, the same can occur with SSDs, where there are cases of component changes such as controllers and NAND flash chips.
Fortunately, Sabrent currently offers only one variant of this SSD, even though it was recently launched. However, it is possible that in the future, they may switch to faster TLC dies, which no one would complain about that, right??
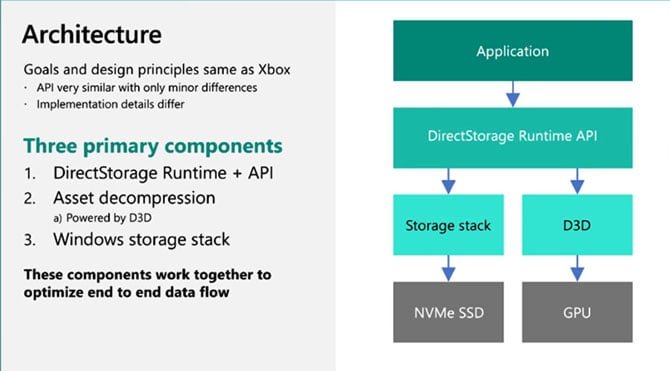
Regarding the Direct Storage, the overall idea behind it is to drastically reduce storage system overhead by eliminating inefficiencies through the use of BypassIO. This is an optimized path for the StorNVMe driver and storage device that significantly reduces the number of steps required to access data. For example, BypassIO reduces the access path from 11 steps to just three, resulting in a significant reduction in CPU load and latency. The NVMe SSD can then be used as a type of data cache for active and streaming data, which can help relieve the load on the GPU’s VRAM. Direct Storage can be implemented in both Windows 10 and Windows 11, but it is expected to perform better in the latter due to its built-in support for the technology.
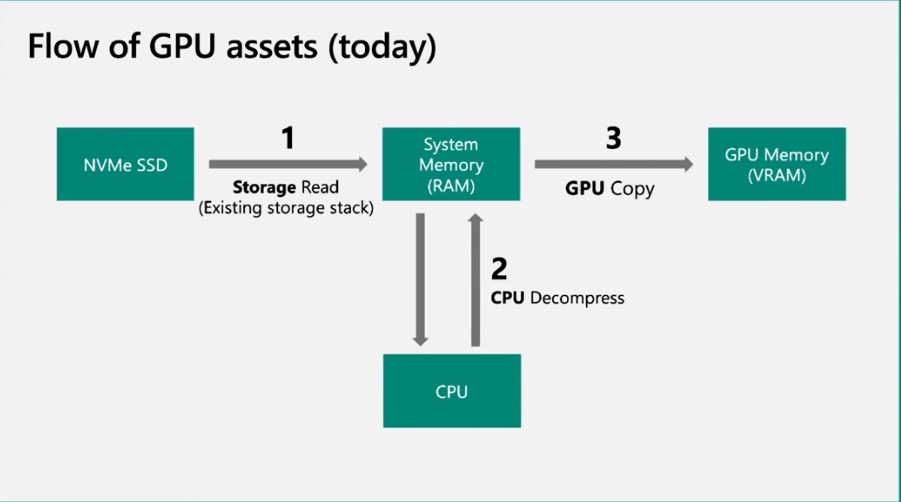
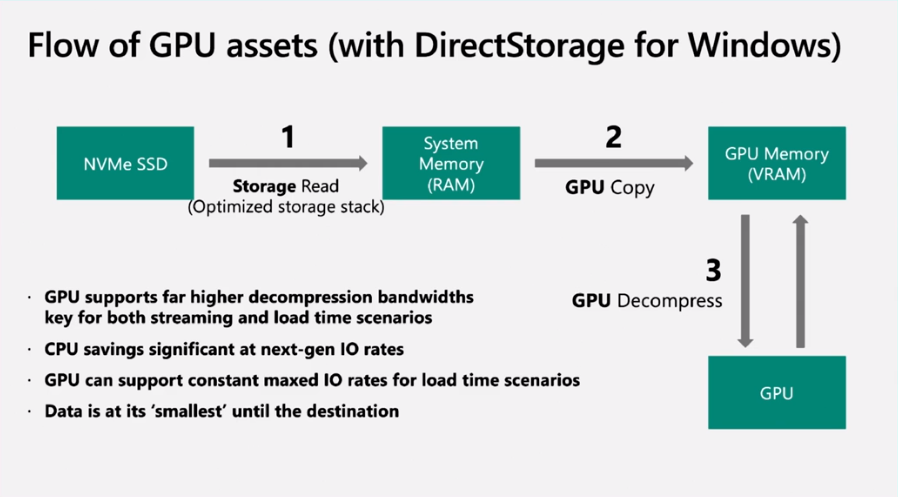
CHALLENGES DIRECT STORAGE HAD TO OVERCOME
However, all of this presents a challenge for more regular SSDs found in the market, as they are designed to handle intermittent workloads or burst operation workloads, which occur suddenly and are not sustained. Phison conducted some custom tests to indicate that a robust SSD capable of sustaining data reads for several consecutive hours is necessary – with a transfer rate of at least 2.5 GBps being the minimum for low quality, but a rate of 5 GBps or higher is much more desirable.
Usually, the metrics used to measure performance in casual scenarios noticeable by an average user are in 4 KiB blocks with low-depth queues, which can vary from 1 to 2 or even 4, depending on the workload and program used.
However, DirectStorage will use large random read accesses at very high queue depths. Therefore, we are dealing with large block sizes, above 16-32KB, and queue depths above 256-512, which are representative of a potential DirectStorage workload and can also be more representative of some data center workloads.
However, there is a potential problem with this type of workload as it can harm the durability of the SSD blocks. A phenomenon known as Read Block Disturb generates physical wear on the blocks that have been read more frequently, causing degradation in their lifespan and durability. Therefore, SSDs will have to cope with this, especially since a game can read more than tens of thousands of pages per hour depending on its implementation and size.
PHISON I/O+ FIRMWARE
“Block Read Disturb” is a problem that is rarely addressed in consumer-market SSDs because of the way they communicate with the operating system and manage I/O requests. However, due to the intensive nature of DirectStorage workloads, the new firmware needs to carefully manage the wear of the NAND Flash while still prioritizing the system’s I/O requests. The constant reading of the NAND Flash can generate bit errors over time, which can temporarily impact the SSD’s performance. Since SSD access remains in high demand, it is crucial to maintain consistent performance. To achieve this, Phison has developed intelligent maintenance scheduling with adaptive wear algorithms that work in the background, ensuring minimal additional wear and consistent performance.
WHERE TO BUY
In case any of you want to buy one of these SSDs, feel free to use one of these links below, so it can help us buy more SSDs to test and show here 🙂 .
Sabrent Rocket 4 Plus-G 1TB – Amazon U$119
Sabrent Rocket 4 Plus-G 2TB – Amazon U$299
Sabrent Rocket 4 Plus-G 4TB – Amazon U$549
Sabrent Rocket 4 Plus 500GB – Amazon U$59
Sabrent Rocket 4 Plus 1TB – Amazon U$99
Sabrent Rocket 4 Plus 2TB – Amazon U$199
Sabrent Rocket 4 Plus 4TB – Amazon U$499
Sabrent Rocket 4 Plus 8TB – Amazon U$1099
TEST BENCH
- Operating System: Windows 10 Pro 64-bit (Build: 21H2) + Windows 11 Pro 64-bit (Build: 21H2)
- Processor: AMD Ryzen 9 5950X (16C/32T) (Fixed frequency on all cores, 4 GHz)
- RAM: 2 x 16 GB DDR4-3200MHz CL-16 Netac (with XMP)
- Motherboard: Gigabyte X570s Aorus Elite AX (Bios Ver.: F5c)
- Graphics Card: RTX 3050 Gigabyte Gaming OC (Drivers: 526.xx)
- Storage (OS): SK Hynix Platinum P41 2TB SSD (Firmware: 51060A20)
- Tested SSD: Sabrent Rocket 4 Plus-G 2TB SSD (Firmware: R4P47G.1)
- AMD X570 Chipset Driver Version: 4.03.03.431.
- Windows: Indexing disabled to not affect test results.
- Windows: Windows updates disabled to not affect test results.
- Windows: Most Windows applications disabled from running in the background.
- Windows Boot Test: Clean image with only drivers and all updates.
- pSLC Cache Test: The SSD is cooled by fans to avoid thermal throttling, which could interfere with the result.
- Windows: Anti-virus disabled to reduce variation between runs.
- Tested SSDs: Used as a secondary disk, with 0% space being used and other tests with 50% space being used to represent a realistic scenario.
- Quarch PPM QTL1999 – Power consumption test: performed with 3 parameters, idle where the disk is left as a secondary and after a period of time in idle a write is performed for 1 hour and the average is taken.”
BENCHMARKS
CRYSTALDISKMARK
We performed sequential and random synthetic tests with the following configurations:
Sequential: 2x 1 GiB (Blocks 1 MiB) 8 Queues 1 Thread
Random: 2x 1 GiB (Blocks 4 KiB) 1 Queue 1/2/4/8/16 Threads


When testing its sequential speeds, we noticed that it delivered incredible results, especially in terms of its write speed. We can see that it took the lead, although by a very small margin. However, it’s quite rare to find SSDs that exceed 7GB/s in sequential write speed.


In terms of latency, we can see that it performed almost identically to its predecessors Sabrent Rocket 4 Plus, as they are almost identical in every way, with only the difference being the larger NAND bus which has a greater influence on random performance.


When testing its random speeds at a queue depth of 4, we can see that there was an improvement compared to the previous line-up, especially in its write speeds, which reached the top of the leaderboard.


When allocating only 1 thread to better represent a typical day-to-day workload, even an SSD designed for direct storage like this still has very similar performance to others, with only a greater advantage in its write speed again.
In this test, three access configurations were made among several queue depth configurations, ranging from QD1, which represents typical daily use, to QD16, which becomes quite surreal and more comparable to virtualized environments.
Officially, Sabrent does not disclose information about its random performance, but we can see that in these more “typical” scenarios it obtains excellent results compared to others, and we can see that it can actually reach the rumored 1,000,000 IOPS.
ATTO Disk Benchmark QD1 e QD4
We conducted a test using ATTO to observe the speed of the SSDs at different block sizes. In this benchmark, it was configured as follows:
Blocks: 512 Bytes up to 8 MiB
File size: 256MB
Queue Depth: 1 e 4.


The ATTO disk benchmark is software that performs a sequential speed test with compressed files. Therefore, to simulate a data transfer load like in Windows, we usually use block sizes ranging from 128KB to 1 MiB. The Rocket 4 Plus Gaming performs better than other SSDs in its reading of very small block sizes and remains competitive for most of the time. However, its performance was slightly below expectations for block sizes ranging from 4KB to 128KB during writing. But after switching to more conventional sequential scenarios with block sizes of 1 MiB and above, it regained its lead.


At Queue depth of 1, we can observe the same behavior again.
3DMark – Storage Benchmark
In this benchmark, various storage tests are performed, including game loading tests such as Call of Duty Black Ops 4 and Overwatch, recording and streaming gameplay at 1080p 60 FPS using OBS, installing some games, and transferring game files between folders.


We can see that in this benchmark with more realistic and traditional traces of everyday use, the new Sabrent line-up achieved a superior result to its predecessor, with the 2TB unit even surpassing the 4TB unit of the previous line-up.
PCMARK 10 – FULL SYSTEM DRIVE BENCHMARK
In this test, the Storage Test tool and the “Full System Drive Benchmark” test, which performs light and heavy tests on the SSD, were used.
Among these Traces, we can observe tests such as:
- Windows 10 boot
- Adobe After Effects: Starting the application until it’s ready to use
- Adobe Illustrator: Starting the application until it’s ready to use
- Adobe Premiere Pro: Starting the application until it’s ready to use
- Adobe Lightroom: Starting the application until it’s ready to use
- Adobe Photoshop: Starting the application until it’s ready to use
- Battlefield V: Loading time until the start menu
- Call of Duty Black Ops 4: Loading time until the start menu
- Overwatch: Loading time until the start menu
- Using Adobe After Effects
- Using Microsoft Excel
- Using Adobe Illustrator
- Using Adobe InDesign
- Using Microsoft PowerPoint
- Using Adobe Photoshop (Intensive use)
- Using Adobe Photoshop (Light use)
- Copying 4 ISO files, 20GB in total, from a secondary disk (Write test)
- Performing a copy of the ISO file (Read-write test)
- Copying the ISO file to a secondary disk (Read)
- Copying 339 JPEG files (Photos) to the disk being tested (Write)
- Creating copies of these JPEG files (Read-write)
- Copying 339 JPEG files (Photos) to another disk (Read)
In this older benchmark that focused more on productivity, we can see again that it performs better than the other SSDs in the previous lineup, but by a very small margin.
PROJECT TEST – Adobe Premiere Pro 2021
Next, we used Adobe Premiere to measure the average time it takes to open a project of approximately 16.5 GB with a 4K resolution, 120Mbps bitrate, and full of effects until it was ready for editing. It is worth noting that the tested SSD is always used as a secondary drive without the operating system installed, as this could affect the result, causing inconsistencies.
When using Premiere to load a project of over 16GB, we again see that it performed decently, but interestingly was slightly inferior to the 1TB unit in the previous line-up, but performed better than the 4TB unit.
GAMES LOADING TIMES AND WINDOWS BOOT TIME
We conducted a comparison between multiple SSDs and an HDD, using a clean installation of Windows 10 Build 21H2 along with the Final Fantasy XIV benchmark in campaign mode. The test consists of the best result after three consecutive system boots, considering the total time until the desktop area with the score reported by the application is finalized, so it is slower than the boot until the desktop screen is displayed.
In this game, we see that the firmware focused on Direct Storage may have benefited the SSD slightly, but the difference is very small, considering that this game does not have Direct Storage, obviously.


When we consider that this program includes the time from boot to the loading of the latest OS drivers, which, in this case, is a clean installation with only OS drivers such as Network, Wireless + Bluetooth, Audio, Nvidia drivers, and PCH, among others, we can see that the Sabrent SSD performed reasonably well. In Windows 10, it outperformed its own 8TB sibling, while in Windows 11, it surpassed the SN850.
SUSTAINED WRITE SPEED TEST | SLC CACHING
The majority of SSDs available in the market use SLC caching technology, which allocates a specific percentage of their storage capacity, whether it’s MLC (2 bits per cell), TLC (3 bits per cell), or QLC (4 bits per cell), to store only 1 bit per cell. This is used as a write and read buffer, where the controller starts the writing process, and when the buffer is full, it writes to the native NAND flash (MLC/TLC/QLC).
Through IOmeter, we can estimate the SLC cache volume of this SSD as manufacturers often do not provide this information. During our tests, we found that it has a dynamic pSLC Cache volume of approximately 218GB to 220GB, which maintained an average speed of around 7032 MB/s until the end of the buffer. This was an impressive speed for this test, especially considering that many Gen4 SSDs struggle to achieve the 7 GBps write speed target.
After writing 220GB, it began writing on blocks programmed natively as TLC. It wrote from 221GB to 1755GB, meaning it wrote over 1500GB in the native TLC state, with an average speed of 3786 MB/s. This is an incredibly fast speed for an SSD. After the native TLC state, it entered the folding process and further dropped to an average of 1671 MB/s, representing the SSD’s worst performance. However, as we will see later, even in the worst-case scenario for this SSD, it still outperforms many other SSDs, including much more expensive ones.ve ones.
Overall, the average speed of the 2TB unit, including its native and folding speed, was around 3159 MB/s, which was nearly double that of the 1TB unit. This significant increase in speed is due to the fact that the 2TB unit has twice the number of dies as the 1TB unit. Additionally, we can see that the 2TB unit achieved the same performance as the 4TB unit, despite the 4TB unit having 64 dies compared to the 32 dies of the Phison E18 controller, which can only communicate directly with up to 32 dies.


We also conducted a test to measure how long the SSD would take to recover part of its buffer during our battery of tests, which lasted from 30 seconds up to 2 hours in idle, with TRIM and garbage collection enabled, and compared it to when TRIM/GC was disabled. When we tested without using TRIM/GC, we observed that it did not manage to recover even 1GB of SLC cache during the test battery, which is normal for the E18 controller with B47R dies.


But when testing with TRIM/GC enabled, we can see that it is able to recover its full volume in just a few seconds.
FILE COPY TEST
In this test, we copied the ISO files and CSGO game files from a RAM Disk to the SSD to see how it performs. We used the Windows 10 21H1 ISO file of 6.25GB (1 file) and the CSGO installation folder of 25.2GB.
Using the 6.2GB Windows 10 ISO, we observed that it had the same time as the 2TB NV7000, which was a great result as it performed slightly better than the 4TB unit.
In contrast, when we used the uncompressed CS:GO folder measuring over 25GB, we noticed a slightly bigger difference among the Gen4 SSDs.
We can see that the Sabrent stands out compared to some Gen4s like the S70 Blade and showed a technical tie with the SN850 and its sibling Rocket 4 Plus 4TB.
TEMPERATURE TEST / THERMAL THROTTLING TEST
In this section of the analysis, we will observe the temperature of the SSD during a stress test, where the SSD receives files continuously, in order to know if there was any thermal throttling with its internal components that could generate some bottleneck or loss of performance.
As we can see, the SSD ends up heating up a lot, just like its predecessor did. Interestingly, even when using the high-end heatsink that Sabrent includes, it managed to get even hotter, which may seem bizarre. However, this led us to notice something related to its speed, which we will show next.


We can see that in the first graph related to temperature, without the heatsink, the SSD’s temperature increases more rapidly compared to when using the heatsink. But why did it get hotter with the heatsink?
In the second graph, we can observe that without the heatsink, the SSD’s speed drops due to thermal throttling to very low speeds of less than 100 MB/s after 100 seconds. After cooling down a bit, its speed rises again to around 4 GB/s until it heats up again to around 75ºC, causing its speed to drop again. This happened in a loop until the end of the test.
When using the heatsink, we can see that it consistently maintained a lower temperature, allowing the SSD to write at a much higher speed for most of the time. It wrote at around 4 GB/s until after 400 seconds, and then entered the folding process, dropping to around 2GB/s. Only after this did we see that the heatsink could no longer cool down the SSD, causing its speed to drop to below 100 MB/s, but this was very close to the end of the test. Therefore, using a good heatsink for this SSD provides a significant advantage.
POWER CONSUMPTION AND EFFICIENCY
SSDs, like many other components in our system, have a certain power consumption. The most efficient ones can perform tasks that are requested quickly and with a relatively low power consumption, so that they can transition back to their idle power states where they tend to have lower power consumption.
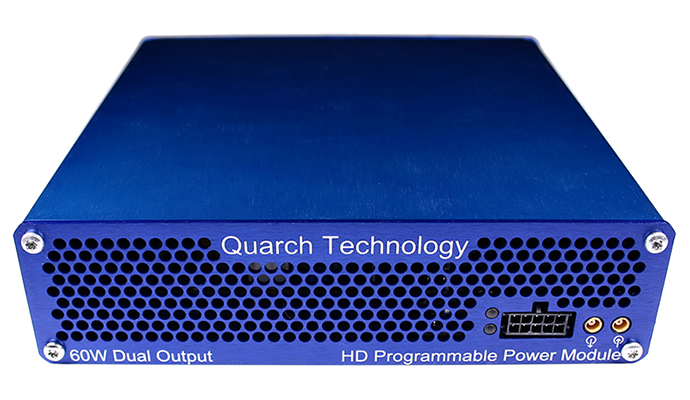
In this section of the analysis, we will use the Programmable Power Module that Quarch Solutions sent us (pictured above) to perform these tests and determine how efficient the SSD is. Three tests will be performed using this methodology: the maximum power consumption that the SSD has, an average power consumption in practical and casual scenarios, and in idle.
The set of tests, particularly those for efficiency and idle power consumption, is important for users who intend to use SSDs in laptops. SSDs spend the majority of their time in low power consumption (idle) states, which can help to save battery life.
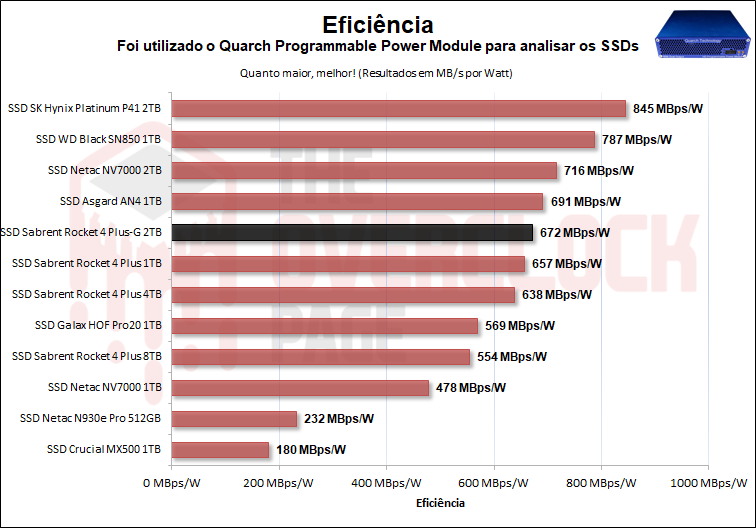
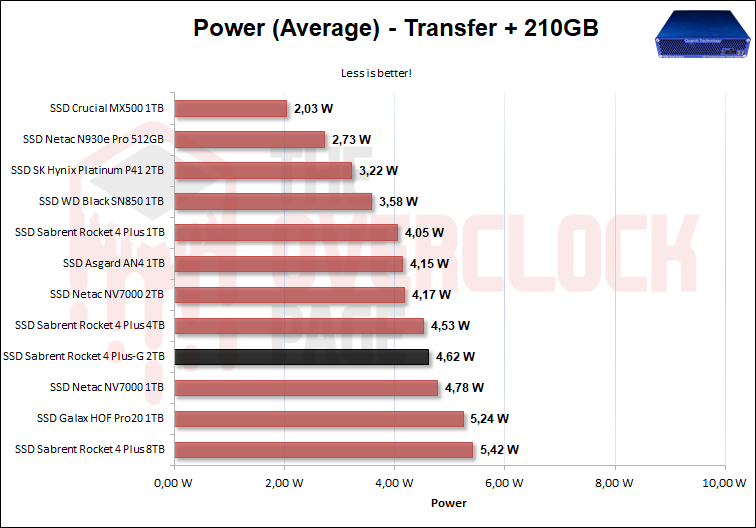
In terms of efficiency, we see that it performs very well, which is due to the fact that even though its average power consumption was slightly high at 4.62W, the sustained speed during the test was over 3,100 MB/s, which resulted in a superior result compared to the entire previous Sabrent lineup, with only the Asgard AN4 being slightly better.
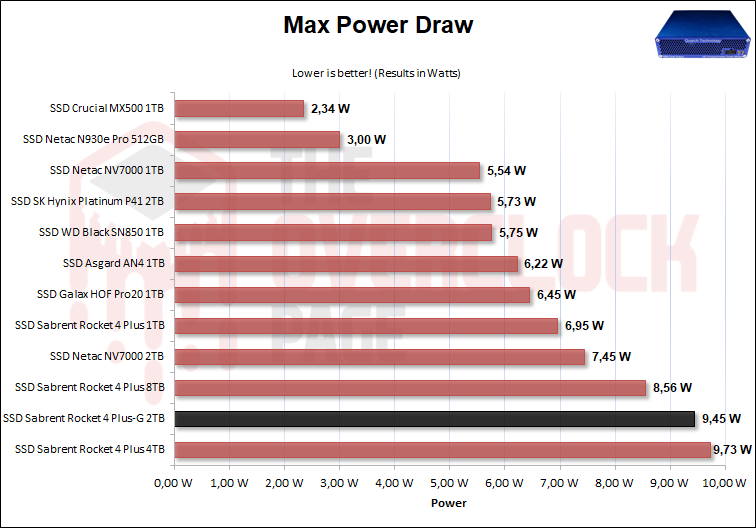
Undoubtedly, such a powerful SSD must have some drawbacks, and in this case, it’s its relatively high power consumption. At its peak, it consumed approximately 9.45W, although this was still lower than the 4TB unit from the previous lineup.
And as we had mentioned about its efficiency, its overall average consumption was almost identical to the 4TB Sabrent Rocket 4 Plus, which is a good result for an SSD with half the capacity, staying below the 1TB NV7000.
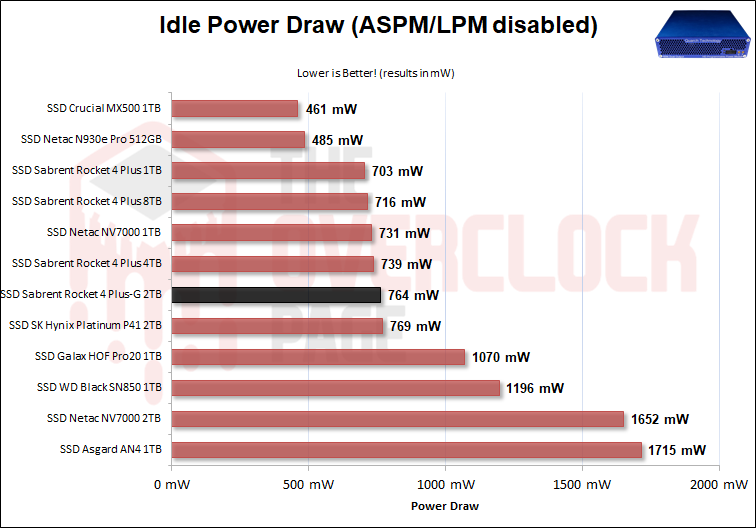
Lastly and most importantly, we tested the Idle scenario, which is the scenario where the vast majority of SSDs are in everyday use. We found that it has great Idle consumption, also being a good choice for laptops that can end up consuming even less.
Conclusion
Taking all of this into consideration, is it truly worth investing in this SSD?
While there is a noticeable difference in performance, particularly in certain scenarios, it may not be significant enough to justify the cost, especially considering the Microsoft API is still in development and this is the first generation of SSDs to implement it.
However, performance and price are crucial factors when selecting an SSD, and in this case, the Sabrent Rocket 4 Plus does not disappoint. It delivers exceptional results, surpassing even its predecessors in various scenarios. Nevertheless, in real-world scenarios where the API is not yet fully optimized, it may be difficult to justify spending an additional $100 for almost identical performance.


Therefore, for those who are enthusiasts or who want to have the best of both worlds, the investment is definitely worth it. But if we analyze it by “Cost per Gigabyte”, the price is totally out of orbit.
ADVANTAGES
- Excellent Sequential speeds, especially in writing, few Gen4 drives can reach 7 GB/s.
- Awesome random performance, improved from its predecessor
- Great Latency results
- Great performance in day-to-day use, also in productivity scenarios as well
- Direct Storage Firmware ready drive
- Amazing construction, great controller paired with fast TLC dies
- Doesn’t suffer (so far) from components swap
- Great SLC Cache size
- Sustained Write speeds are incredibly high, almost 4 GB/s
- Bundle of software with numerous functionalities.
- Great endurance ratings, although the 4TB had a slight decrease in 200TB
- Excellent Power Consumption Efficiency
- Low Idle power consumption
- 5-Year Warranty (2-Years w/o registration)
DISADVANTAGES
- SSD suffers thermal throttling in heavy or long workloads even with Heatsink
- SLC Cache recovers only with TRIM/GC
- M.S.R.P. is way too high
