Review – Ryzen 9 7900 – Performance and Efficiency in one CPU!
Some time ago, we posted an article on extreme overclocking with the Ryzen 9 7900, which is the 12-core CPU that, at least on paper, tends to be quite efficient with its TDP of only 65W. In that occasion, we managed to go beyond 6 GHz using dry ice, and while the results were very satisfying, we are still yet to see what the R9 7900 is capable of under more normal conditions, something we will explore in this article! 😀

The Ryzen 9 7900 utilizes AMD’s latest architecture, Zen4, which was implemented using TSMC’s 5 nm process. Compared to its predecessor, Zen3, it brings several improvements. For instance, it introduces support for AVX-512, which should greatly enhance performance in emulators. Additionally, the L2 cache has been doubled, and various enhancements have been made to the architecture itself. The manufacturing process has also played a significant role, allowing for a substantial increase in the CPU’s operating frequency.


Regarding the IO/Die, it has also undergone changes and is now manufactured by TSMC using the 6nm process. This has allowed AMD to integrate a small GPU based on the RDNA2 architecture. However, according to the company, this GPU is not intended to deliver high-performance capabilities but rather meets the demands of corporate clients.
In terms of SOC (System-on-Chip) topology, it remains largely unchanged from the Ryzen 3000 “Matisse” series. The main difference lies in a block responsible for synchronizing the Infinity Fabric and the memory controller. These two domains operate at different frequencies, and while working with different FCLK and UCLK proportions was possible before, it was not ideal in terms of performance.


In addition to the obvious changes in the socket, which transitioned from PGA (Pin Grid Array) to LGA (Land Grid Array), and the memory standard, which is now DDR5, the new platform has also allowed AMD to release processors with higher TDP (Thermal Design Power). It has “unlocked” an additional four PCIe lanes and solidified USB BIOS updates, which were previously implemented at the discretion of the manufacturers.
Regarding the available chipsets, there is only one die called “Promontory 21,” which gives rise to the four existing combinations: X670E/X670/B650E/B650. To create all these variants, AMD simply chose to “double” the number of chips in the X670E/X670 models, where the main differentiating feature of the “E” variants is support for PCI-E 5.0 in the 16x GPU slot.


With the introductions out of the way, let’s dive into the tests!
- Hardware tested:

This might include affiliate links, which helps to maintain the site.
CPU: AMD Ryzen 9 7900 / Intel i9 12900K
MOBO: B650M Aorus Elite AX e ASUS Maximus Z690 Apex
VGA: Powercolor RX 6800 XT Red Devil
RAM: 2x8GB Jazer DDR5-5600 CL40
COOLING: XPG Levante 240mm and GD-2 Thermal Paste
STORAGE: Xraydisk 240 GB e Kingston A400 960 GB
PSU: Seasonic 750W
Software and drivers: Windows 11 x64, Adrenalin 23.5.1, 7Zip 21.07 x64, Blender 3.1.2, Cinebench R20, Dolphin 5.0 CPU Benchmark, Geekbench 3.4.4, Google Chrome, HWBOT x265 Benchmark, Luxmark 3.1, PCMark10 e CapFrameX.
Objective of the tests: To assess the performance of the Ryzen 9 7900 through a series of benchmarks using different configurations, starting from the default 65W and gradually increasing to 105W, 120W, and even 170W, in order to discover the impact of the reduced TDP on the CPU’s performance. Additionally, some tests include results from the i9 12900K to provide a performance reference in these scenarios.
Further details about the tests are provided in the following texts.
- PPT, EDC, and TDC? What is that???
Before we delve into the results, it’s important to provide an explanation about “Precision Boost Overdrive” (PBO), which was introduced with the Ryzen 2000 series. This feature allows users to extract greater performance by modifying certain CPU parameters, effectively enabling a “controlled overclock” through the processor’s boost algorithm.
Among these parameters, three of them are crucial for this article, as they were used to make the Ryzen 9 7900 operate as if it were a 105W, 120W, and 170W models. These parameters are known as PPT (Package Power Tracking), TDC (Thermal Design Current), and EDC (Electrical Design Current).
To put it simply:
PPT is the total power that the CPU can consume, typically around 35% higher than the TDP (Thermal Design Power) of the processor in question.
TDC is the sustained current supplied to the CPU under heavy load. It is limited both thermally and electrically. When running demanding tasks for an extended period, such as a Blender rendering, TDC represents the maximum current the processor can draw while respecting temperature and voltage limits.
EDC refers to the amount of current supplied to the CPU in short bursts, limited by the maximum voltage.
- 2D Benchmarks:
Regarding the benchmarks used, the tests were conducted on an updated Windows 11 operating system. The numbers were obtained with HPET (High Precision Event Timer) disabled, except for the HWBOT x265 benchmark, which requires HPET activation. Each test was run for a minimum of three rounds, discarding the best and worst results to ensure accuracy.
For stock tests, memory modules were used at their maximum specified frequency for each CPU. This means DDR5-5200 CL40 for the Ryzen CPU and DDR5-4800 for the Core i9 CPU.
- 7Zip: A popular open-source file compression/decompression tool. The integrated benchmark was used with default settings.
- Blender 3.1.2: An open-source software used for 3D modeling, rendering, and animation. The “Car Demo” scene, commonly used for benchmarking, was rendered.
- Cinebench R20: A traditional rendering benchmark that utilizes the Cinema 4D engine. It scales with multiple threads, uses AVX2 instructions, and allows testing in single-threaded and multi-threaded modes.
- Dolphin 5.0 CPU Benchmark: This test uses the Dolphin emulator for GameCube/Wii to process the luabench, providing an indication of each processor’s performance in emulation. The standardized version used in the tests was Dolphin 5.0 “for dummies.”
- Geekbench 3: A multi-platform benchmark that tests performance in various algorithms using the CPU in different ways (INT or FP), encryption using AES, and memory tests.
- HWBOT x265 Benchmark: This benchmark utilizes the open-source x265 encoder to convert video from H264 to H265/HEVC format and measure the average FPS. It is a multi-threaded test that can utilize AVX instructions if available. The 4K preset was used without altering other settings.
- Luxmark 3.1: A benchmark tool for rendering using OpenCL or C++ with the LuxRender engine, which is open-source and allows for comparison between CPUs and GPUs. The C++ mode was used for this test.
- Octane 2.0: This benchmark package consists of 17 JavaScript tests, providing a reference for CPU performance while browsing the internet. As this benchmark runs directly in the browser, the latest version of Google Chrome was used to obtain the results.
- PCMark10 Express: A general-purpose benchmark tool that tests various aspects of everyday computer usage. It simulates application startup times, internet browsing, video conferencing, and office applications. PCMark10 Express was used with the “Express” preset, utilizing real-world open-source software for each function. The RX 6800 XT GPU was used and the PCMark10 application were installed on the Kingston A400 SSD.
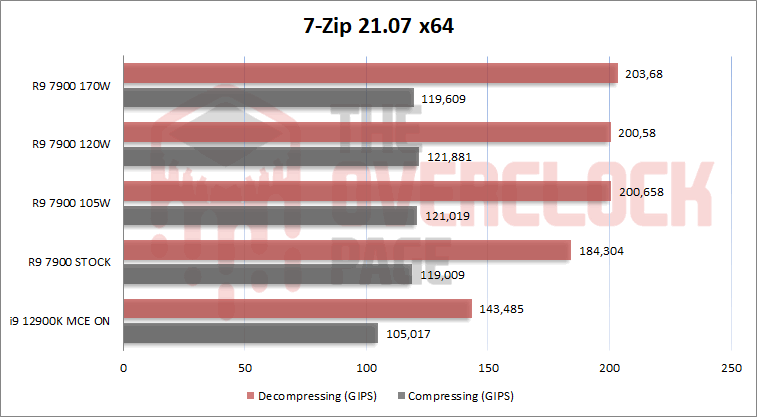
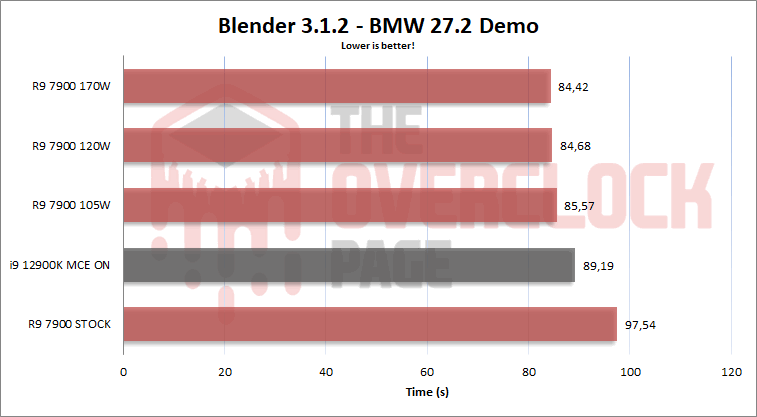


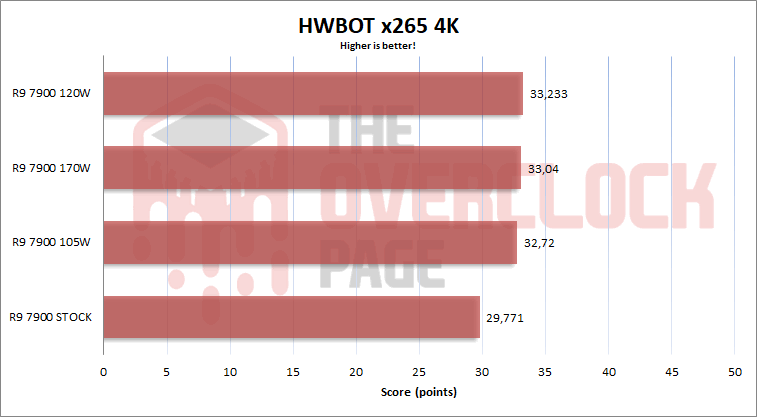
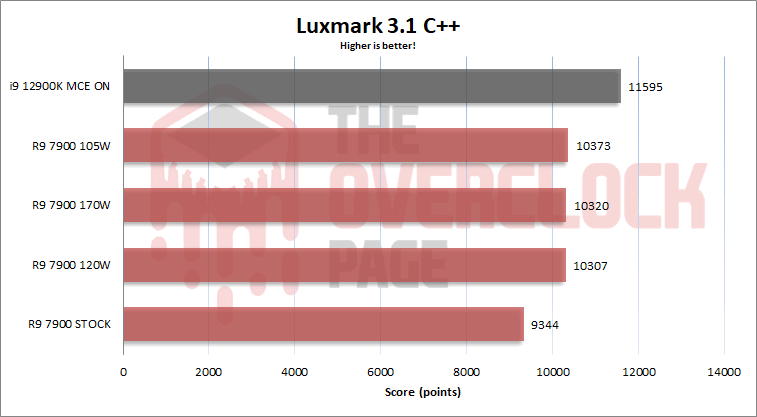
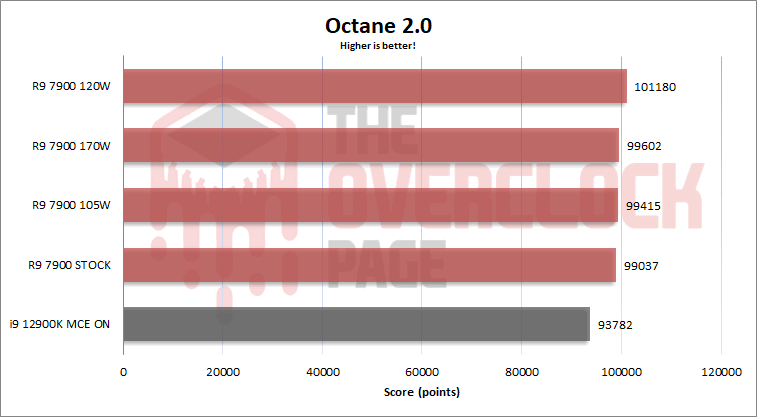
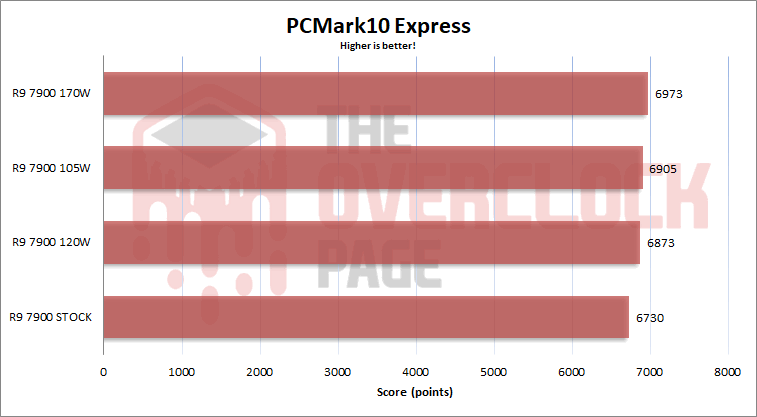
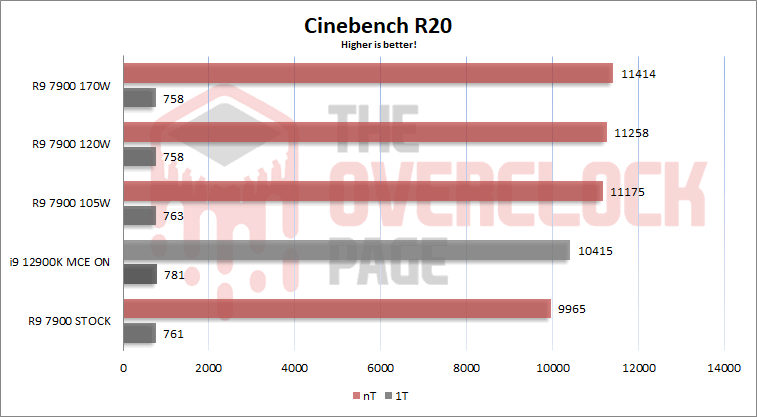
Regarding single-thread (1T) performance, as expected, the R9 7900 was not limited by its 65W TDP. The individual power consumption of each core tends to be lower than 15W, so there was still ample headroom even with the default settings. This is evident from benchmarks such as Cinebench R20 and Geekbench 3 single-thread, where the scores remained within the margin of error even with higher TDPs.
As for multi-thread (nT) performance, the increased TDP allowed for gains of up to 15% in some cases, such as Cinebench R20 MT and Blender. However, even in these tests, most of the performance improvement was achieved at 105W, with marginal gains scaling up to 170W. In comparison to the i9 12900K with MCE (Multi-Core Enhancement) enabled, it initially had a slight advantage over the R9 7900 at stock settings. However, this advantage disappeared once the TDP of the Ryzen processor was “unlocked” up to 105W.
- Gaming benchmarks:
Let’s proceed with the gaming tests. The following titles were used:
The 3DMark Time Spy is a synthetic benchmark that uses DX12, compute shaders, SSSE3, and various other features commonly found in modern games. This makes it a good comparative tool in these scenarios and is also used in overclocking rankings. You can find its whitepaper at this link.
BeamNG is a physics-based driving game that includes the BeamNG Banana Bench tool. This tool simulates game performance as the number of AI-controlled cars increases and returns the best result obtained. It should be noted that this test demands slightly less from the CPU compared to the actual game since it runs in text mode and doesn’t have the rendering load.
In Cyberpunk 2077, the last version of the game was used, running at 720p on the “Low” preset and 1080p on the “High” preset. The built-in benchmark was used.
In CS:GO, the FPS Benchmark map was used with the game running at 768p, while the remaining settings were adjusted to match those of a professional player. Competitive players often sacrifice details in favor of achieving the highest possible frame rate to reduce input lag.
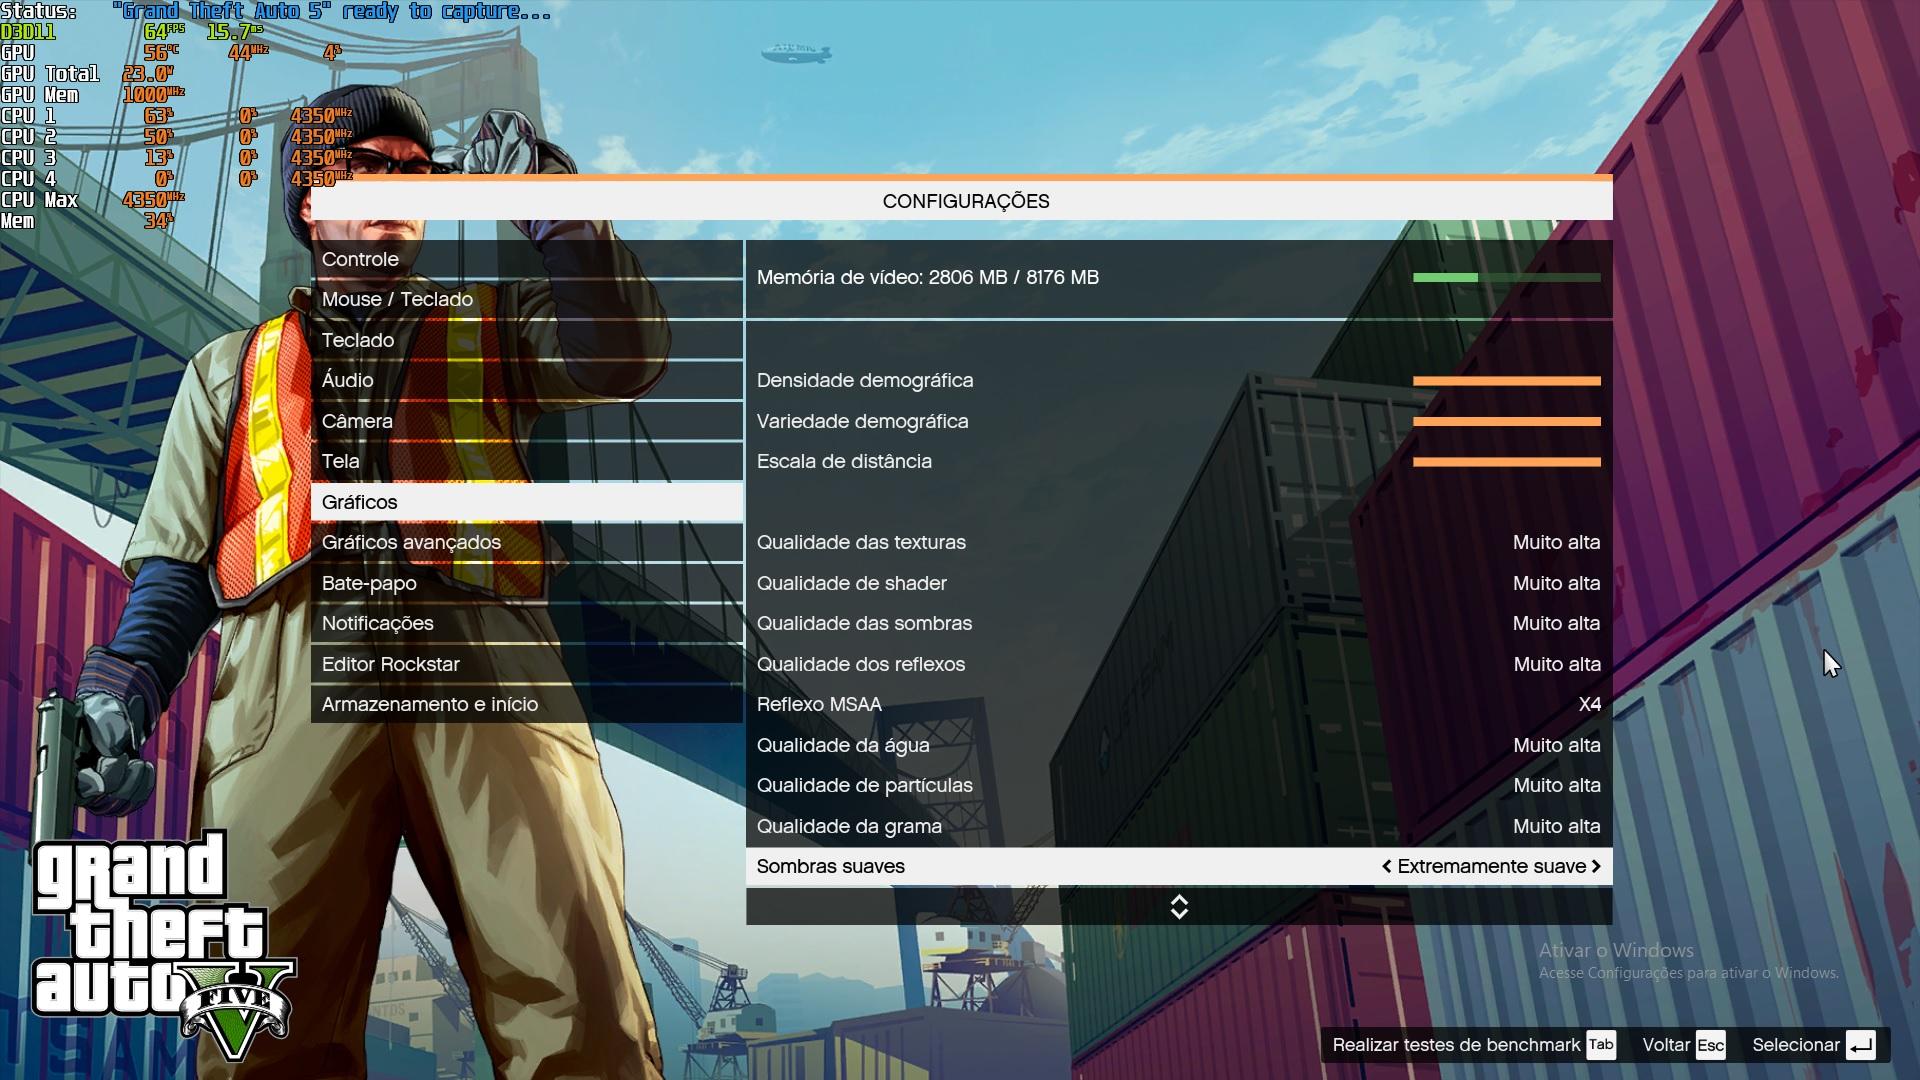
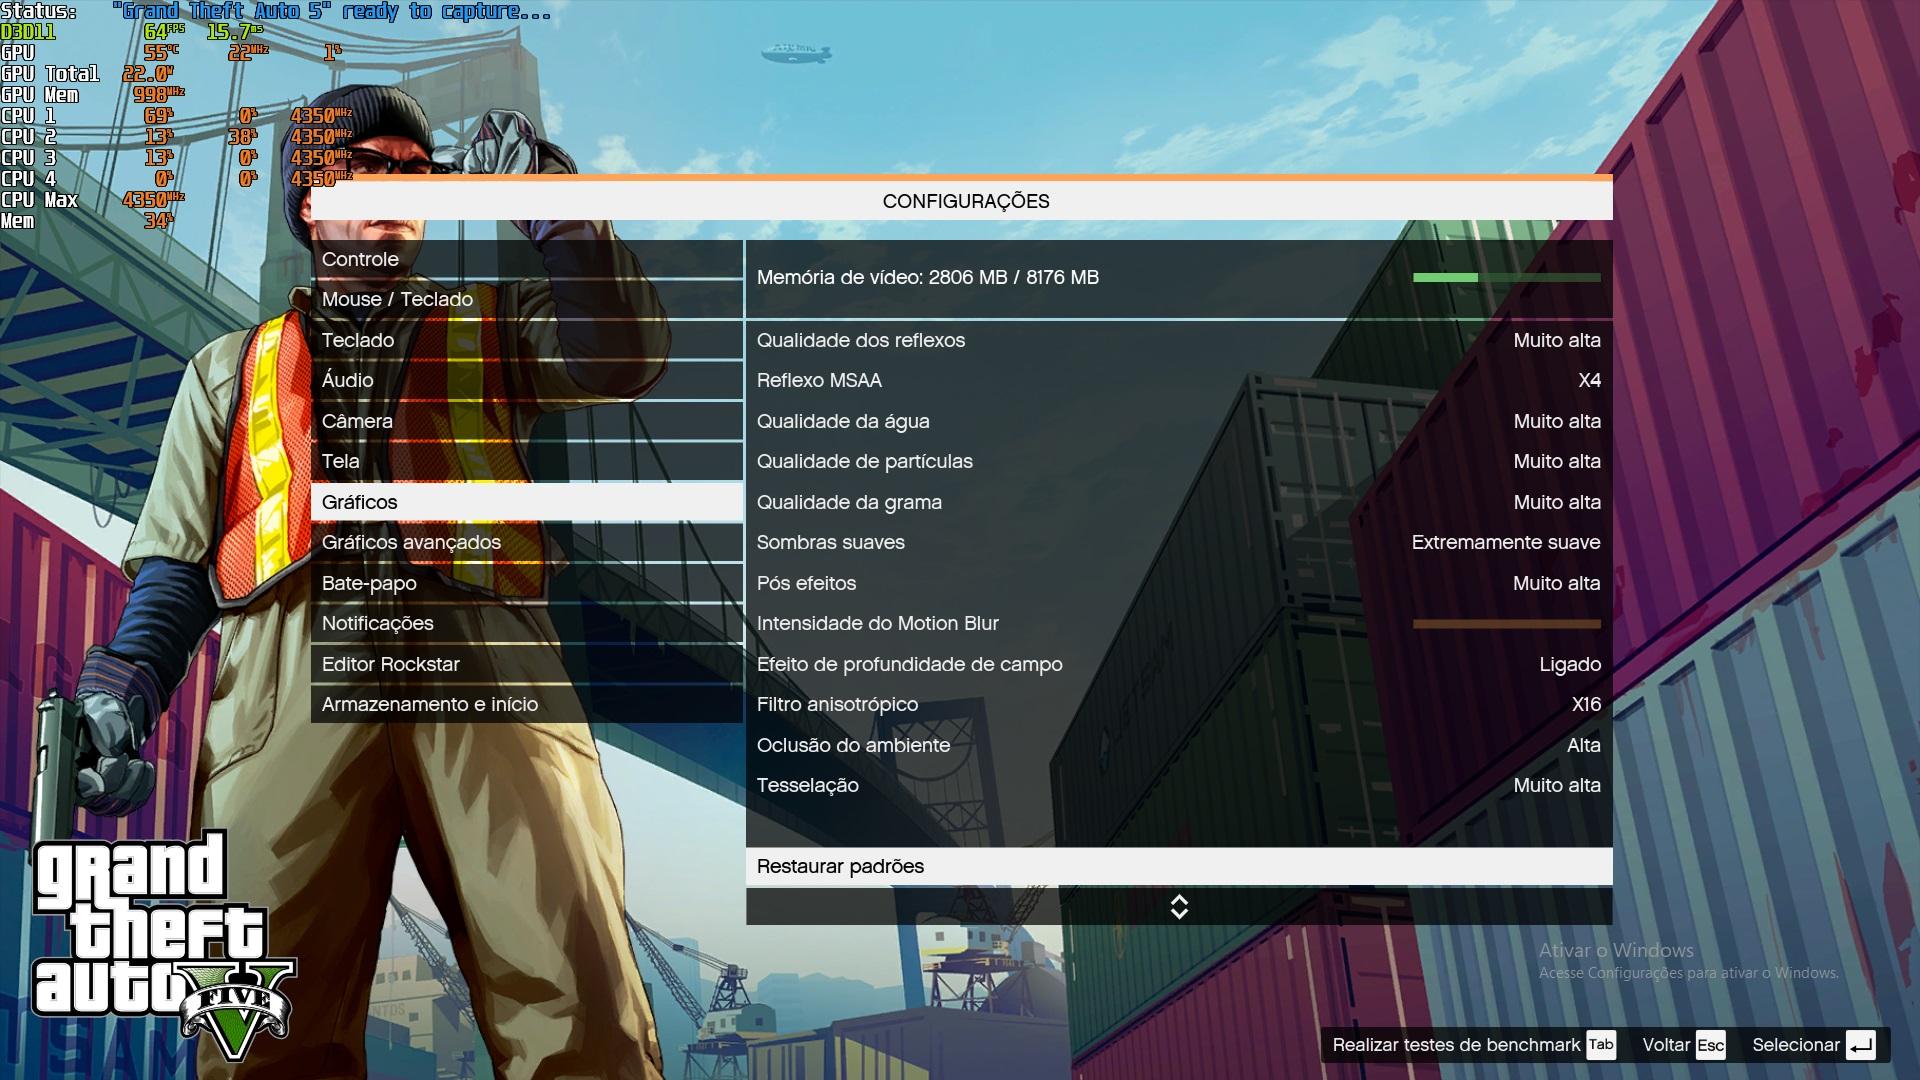
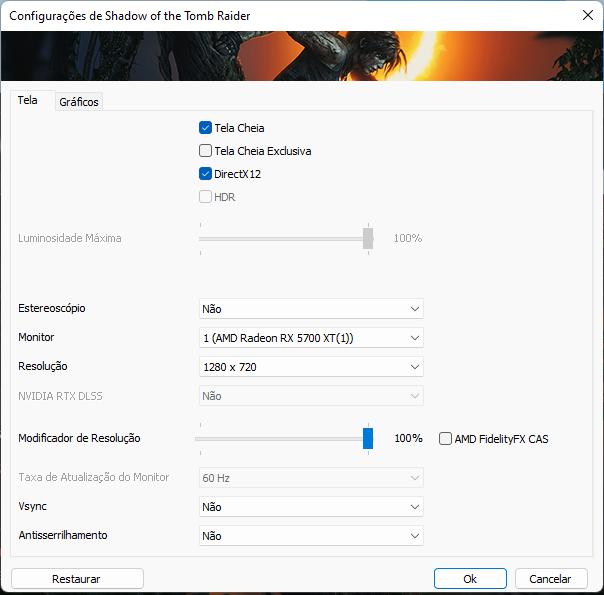
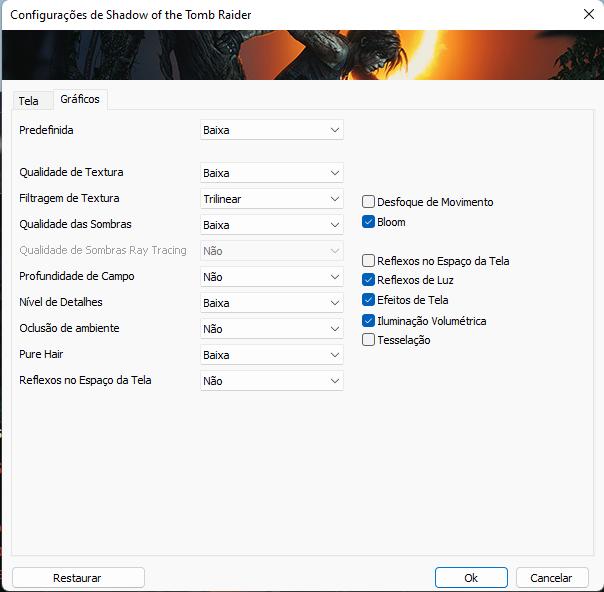
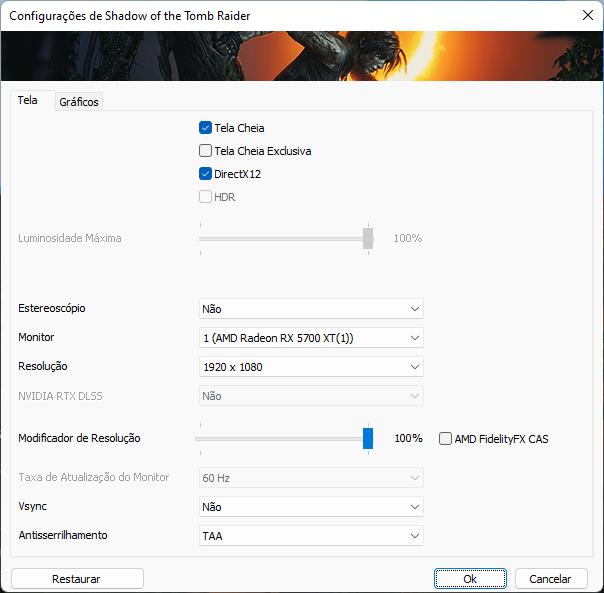
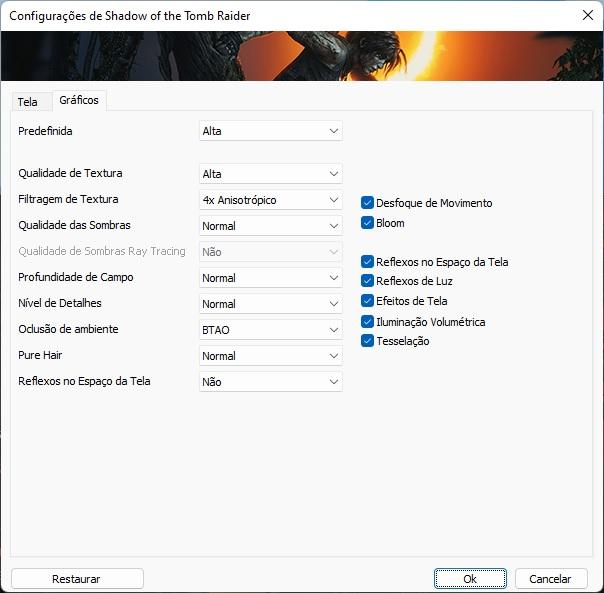
For Shadow of the Tomb Raider (SOTTR), the built-in benchmark of the game was used with the configuration set to 720p on the “Low” preset and 1080p on the “High” preset with TAA enabled. Below are the graphical settings used to obtain the results.
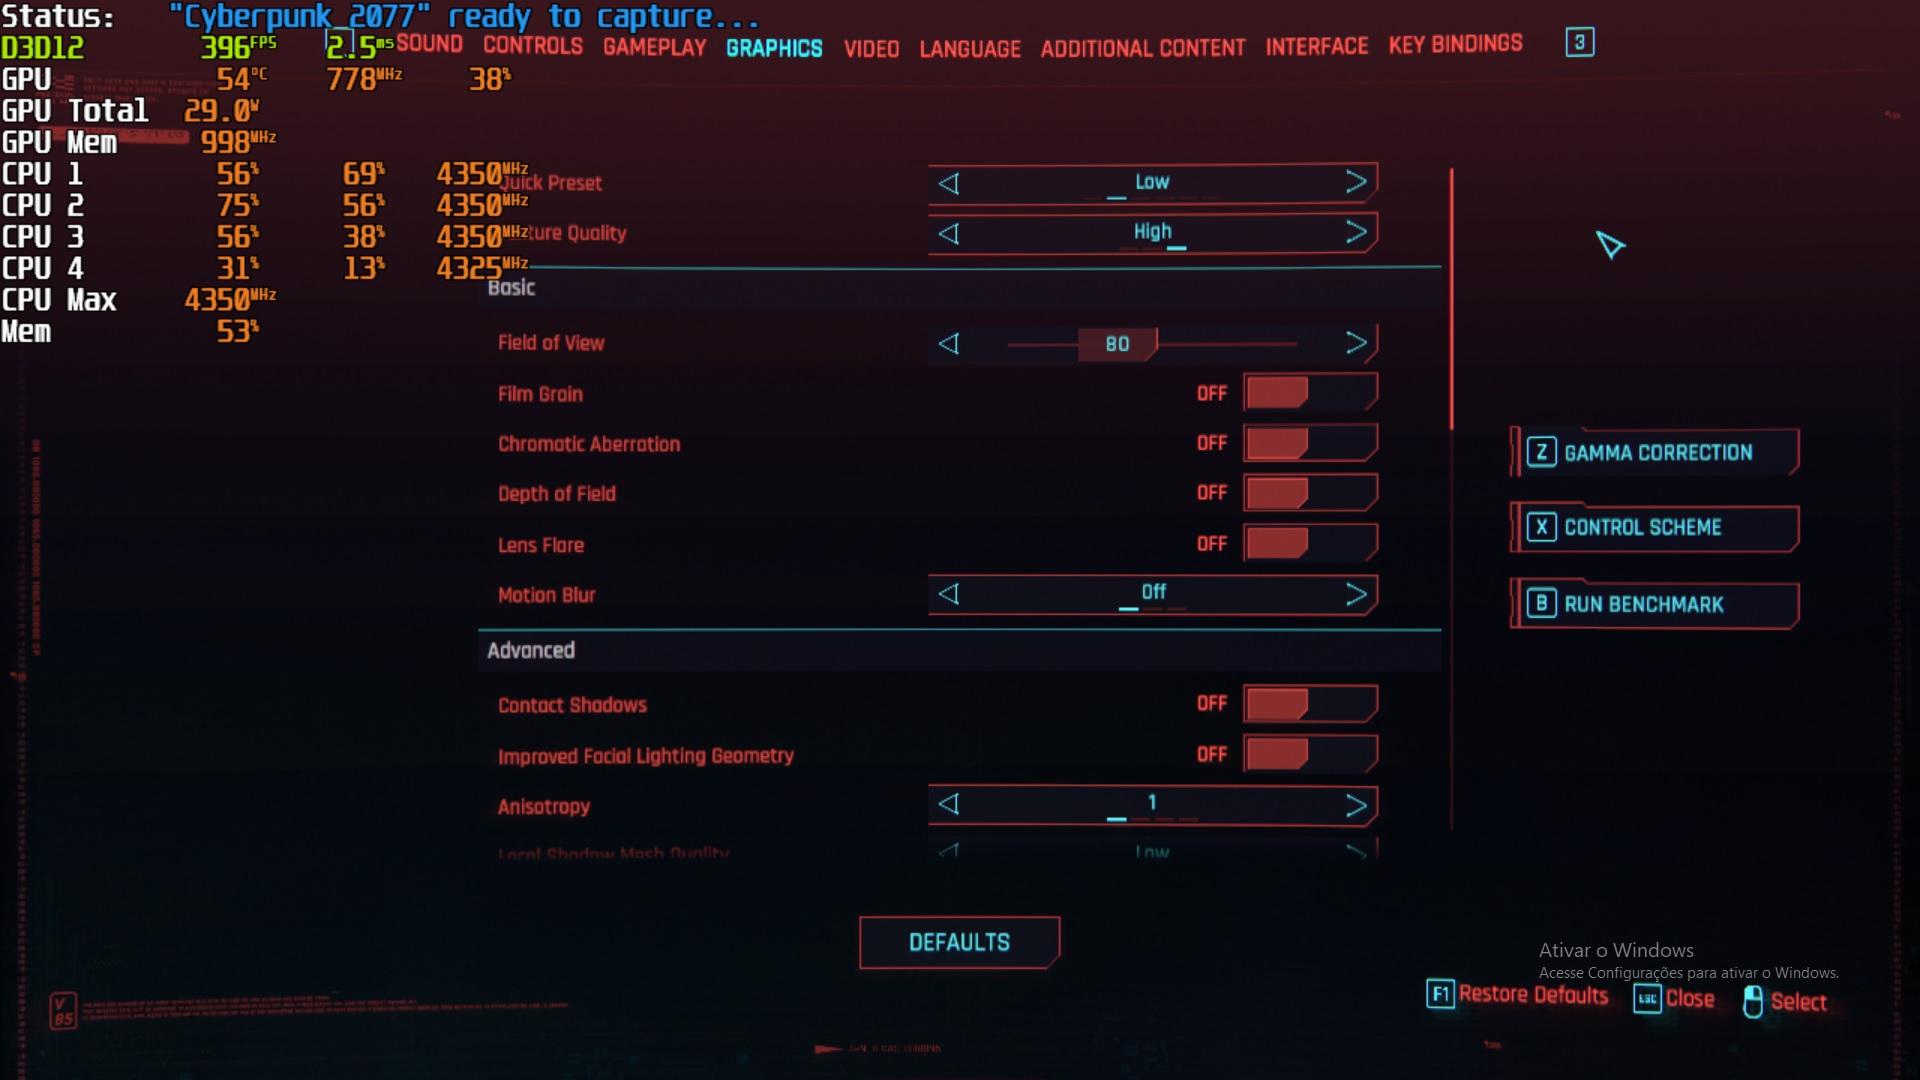
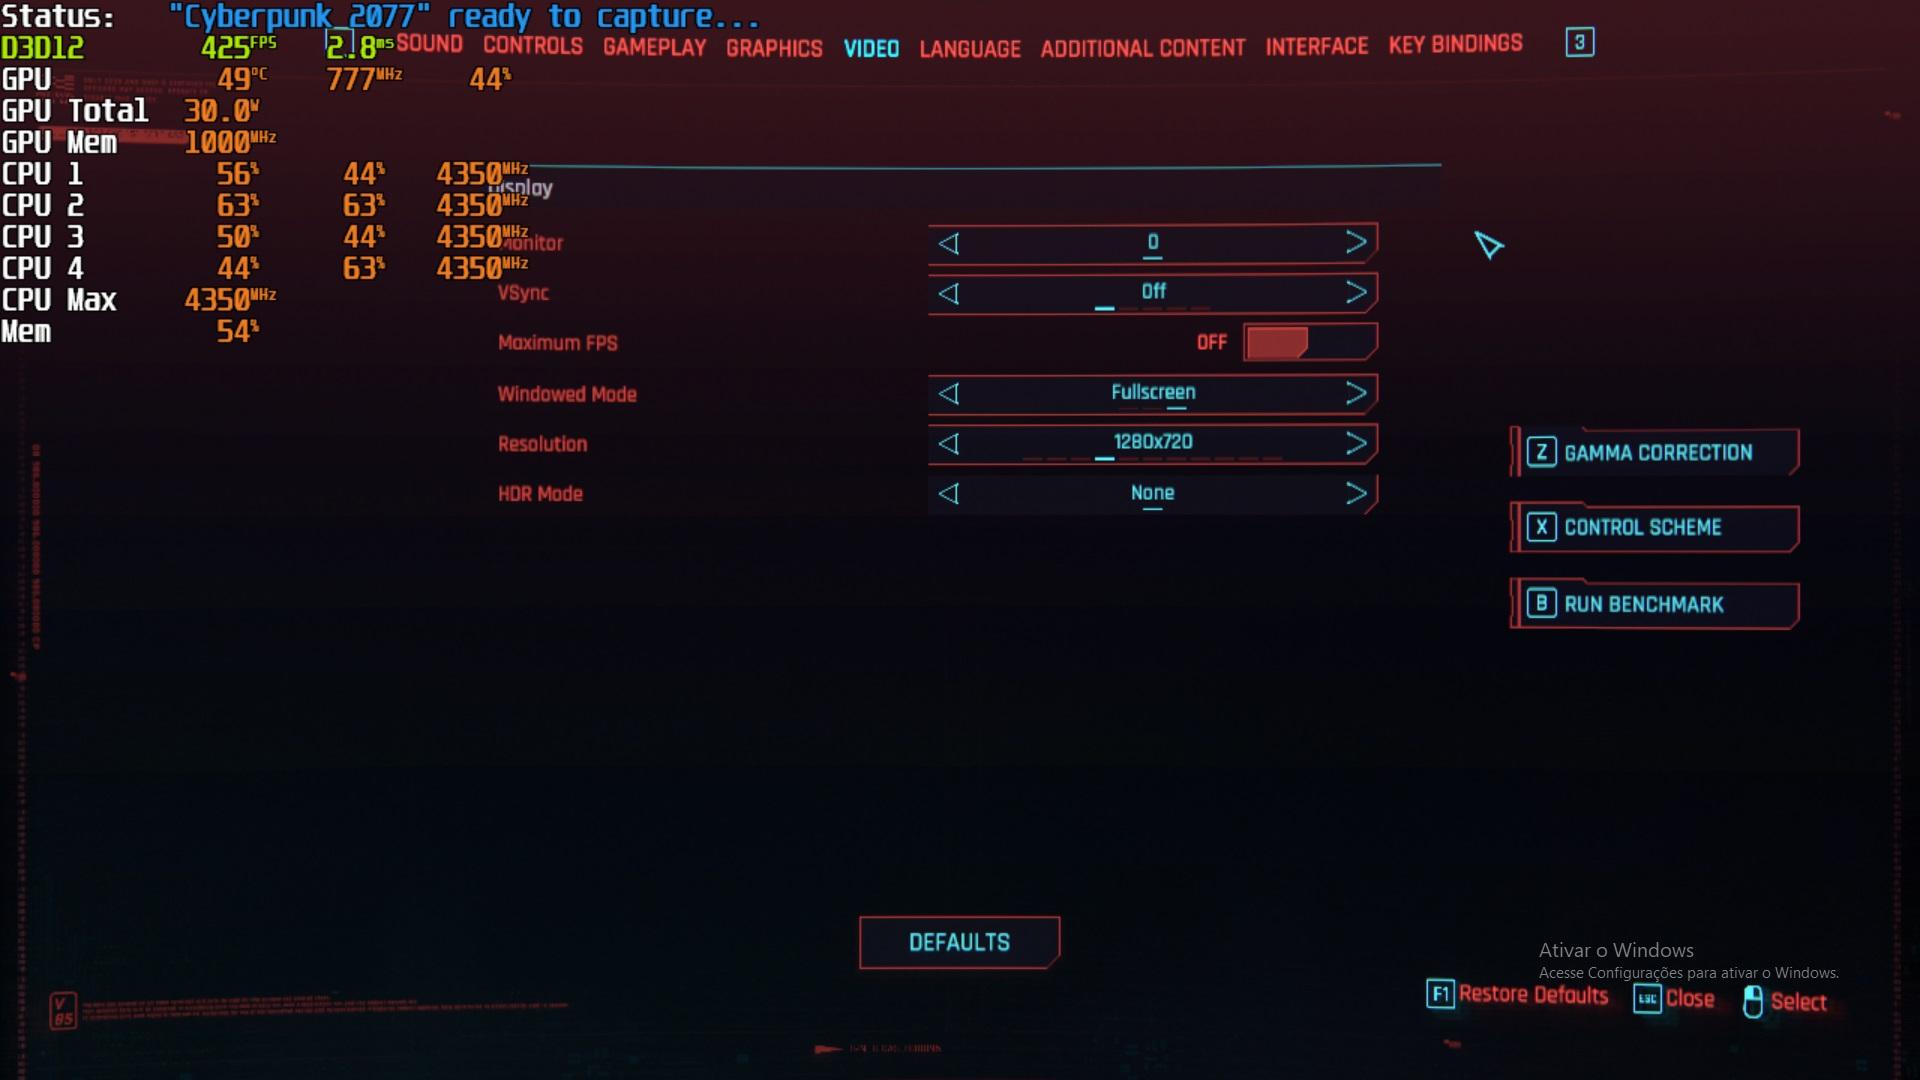
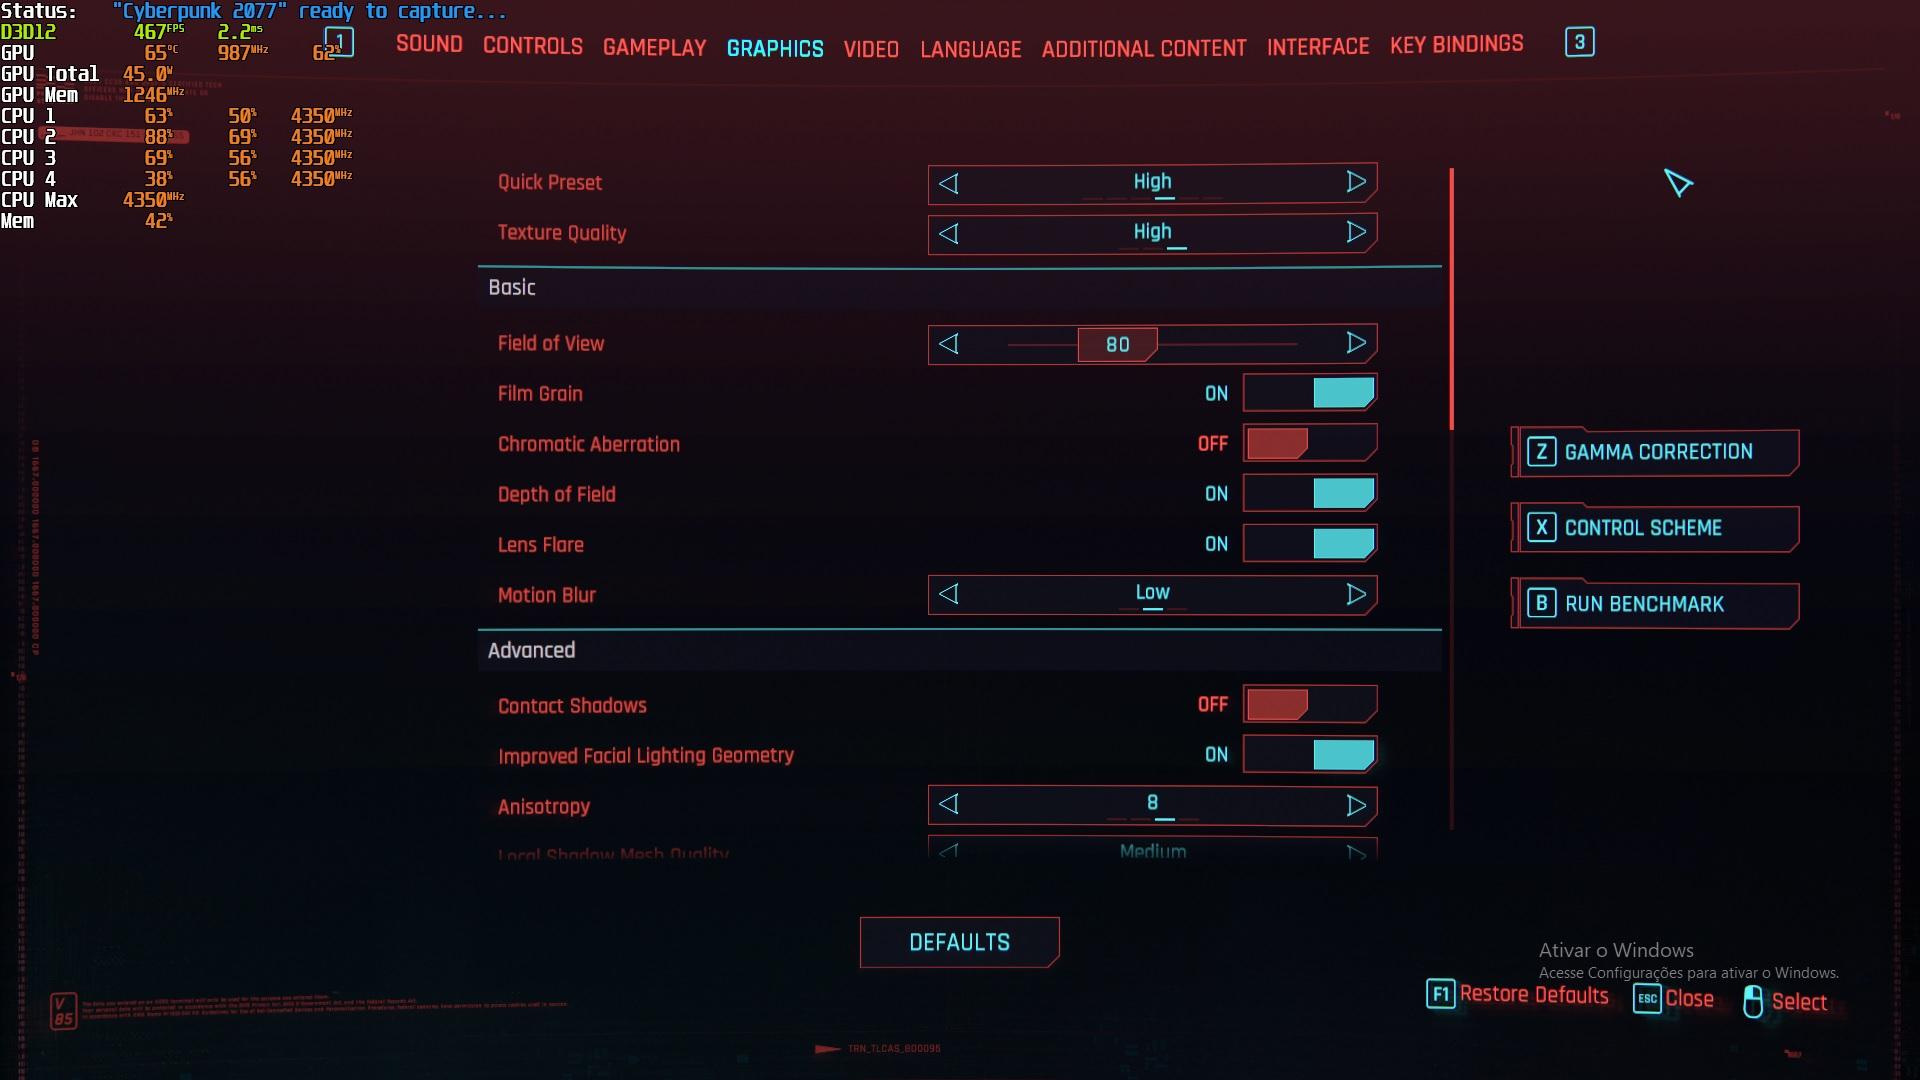
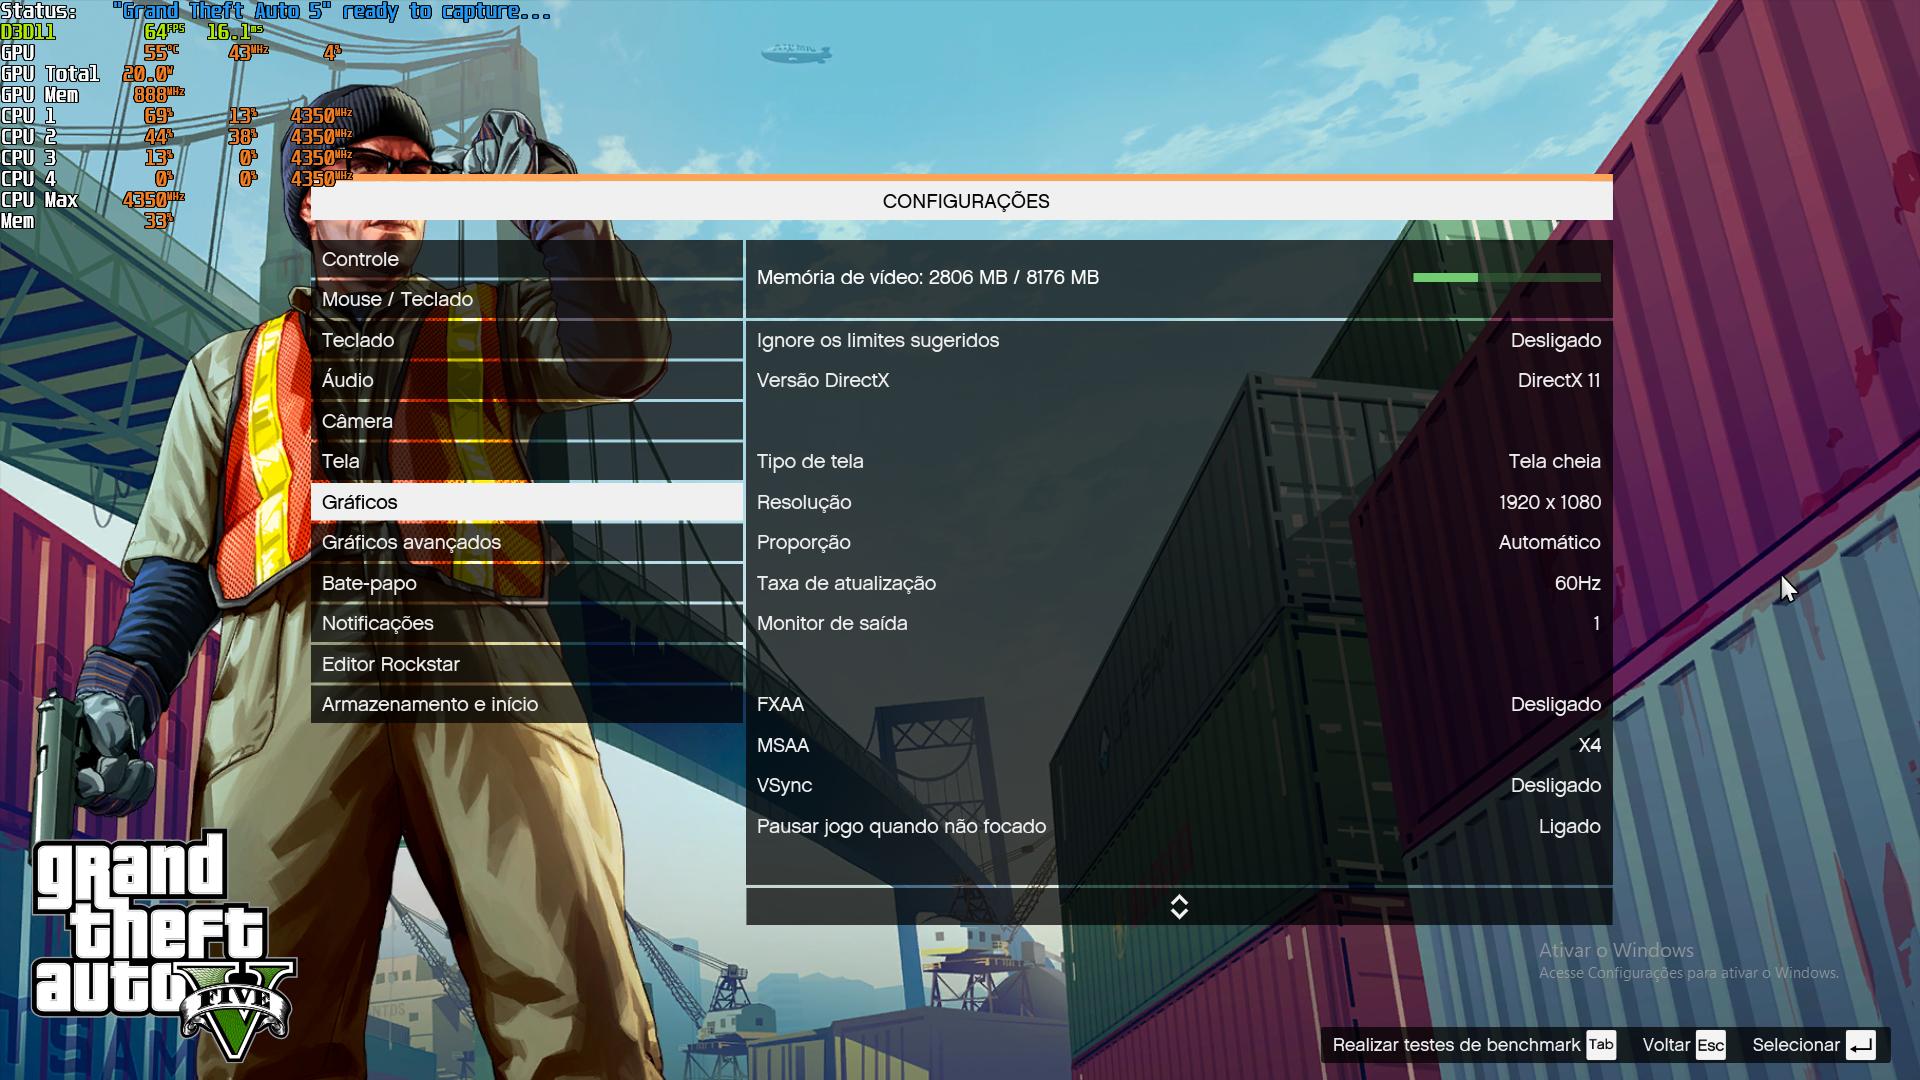
- Synthetic benchmarks:
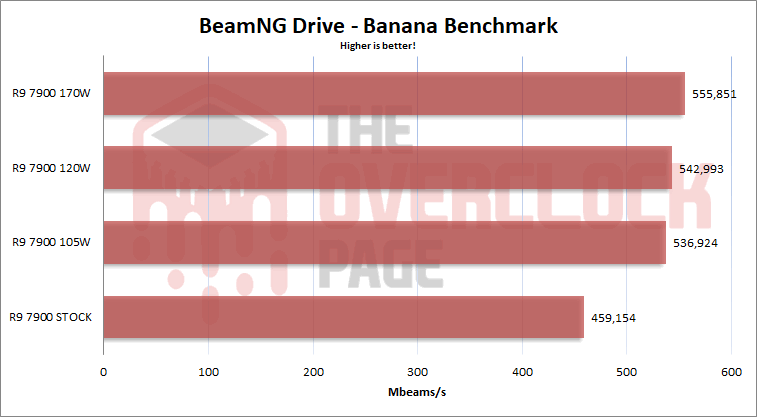
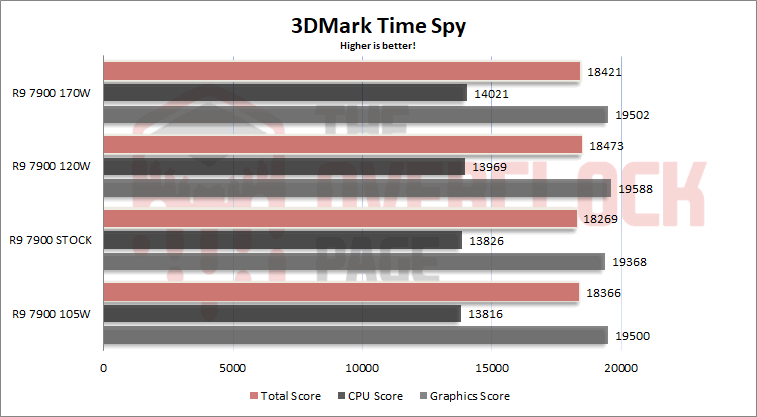
In synthetic benchmarks, there were reasonable performance gains in BeamNG Drive when increasing the CPU TDP, which is expected since the game scales well with more threads. However, in Time Spy, the gains were more modest.
- Gaming benchmarks – 720p/768p/1080p:
It is a valid question to wonder why someone would play games at 720p in 2022. However, the purpose of testing games at this lower resolution is to determine how far each CPU can push frame rates in a scenario where the GPU is not the limiting factor. This is particularly relevant to assess whether the CPU can handle a more powerful GPU without significantly limiting its performance or if it can maintain minimum frame rates when using a high-refresh-rate monitor.
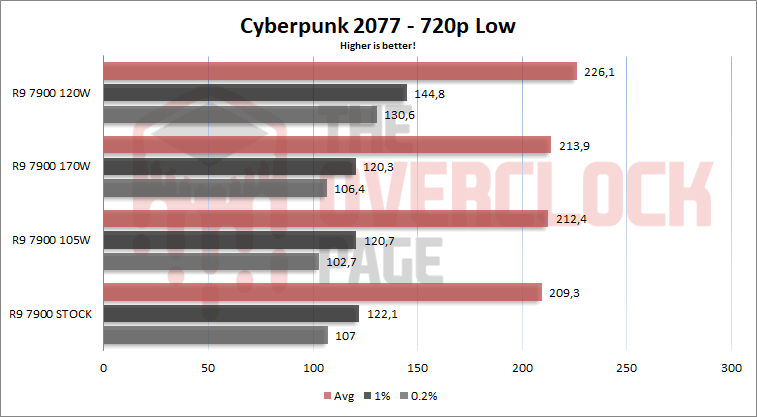
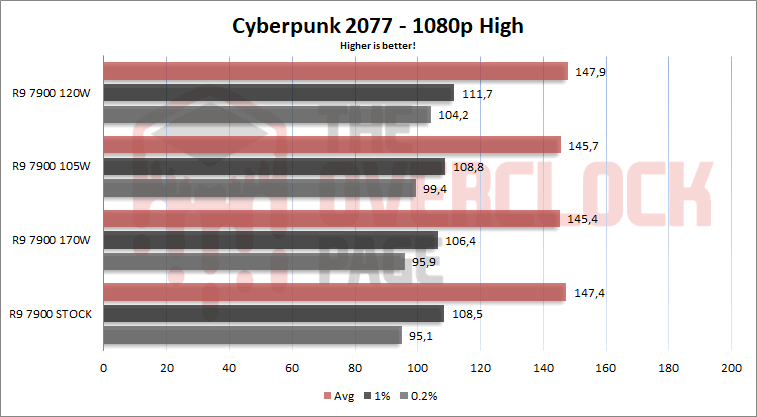
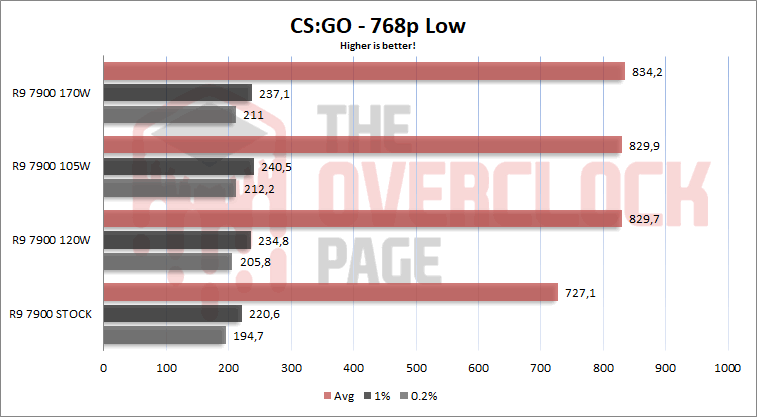
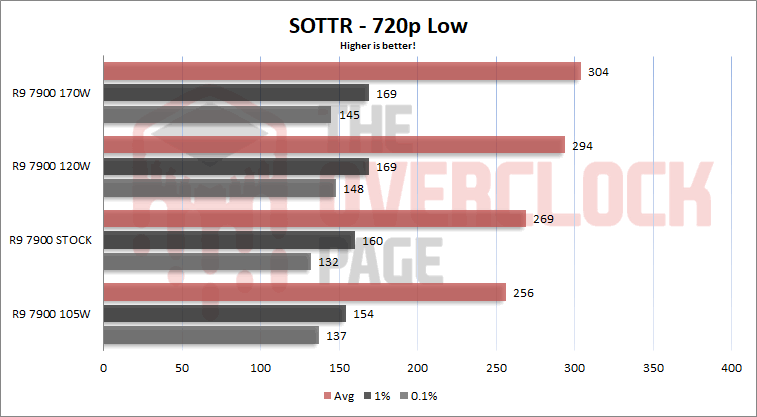

Each game responded differently to the additional TDP headroom. For example, CS:GO showed a significant jump in performance when going from 65W to 105W, but there were hardly any gains beyond that. On the other hand, in SOTTR and Cyberpunk 2077, the gains came with 120W, with minimal differences observed at 105W and 170W. However, it’s important to note that the differences were quite small, especially at 1080p resolution.
- Power consumption and temperature:
The power consumption was measured directly at the 8-pin connectors on the motherboard using an ElmorLabs PMD, which allows monitoring of current, voltage, and power both on the EPS connectors and the PCI-E connectors.
Blender was used to render the Classroom animation for approximately 15 minutes to record both the power consumption and temperatures under load. Specifically, in terms of power consumption, it was quite similar to what was observed in Cinebench R20, and the same trend was observed in other situations where the processor is limited by TDP. The ambient temperature on the day of the tests was around 25 °C.

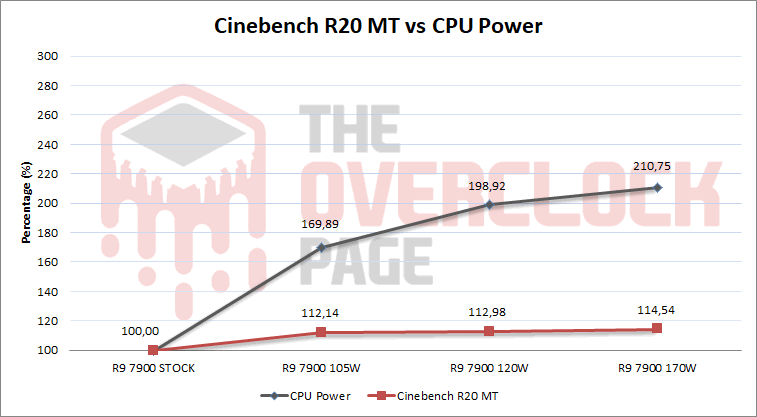
The Ryzen 9 7900 proved to be extremely efficient at its default TDP, ensuring that it should not pose a challenge even for the most basic motherboards. However, when increasing the TDP limits, power consumption increased by 70% at 105W and nearly doubled at 120W. However, this increase in power consumption did not translate into performance gains in the same proportion, with only a 13% increase for double the power consumption.
Regarding temperatures, at stock settings, the R9 7900 reached a peak temperature of 56 °C for the hottest CCD. With a TDP of 105W, the temperature increased to 78 °C, 88 °C with 120W, and finally exceeded 90 °C with 170W.
- Conclusion:
Regarding performance in applications, the Ryzen 9 7900 performed very well, coming close to the i9 12900K in various tests, but with lower power consumption and heat dissipation. Simply increasing the maximum TDP to 105W was enough to surpass the Intel processor.
It is worth noting that the gains in single-threaded performance were modest or non-existent when increasing only the TDP. It’s important to mention that this article did not touch on the maximum boost offset adjustment, so the gains here were only in multi-threaded applications.
In terms of gaming performance, the R9 7900 performed well even at stock settings, gaining performance by increasing the TDP to 105W in CS:GO and 120W in SOTTR and Cyberpunk 2077. However, it’s important to observe that the performance gains were generally modest and more restricted to 720p resolution. This is something that will likely only interest those who need to squeeze every bit of performance from their system. In such cases, there are more efficient approaches, which will be discussed in another future article.
Regarding power consumption and thermal dissipation, as expected from a model with a TDP of only 65W, the R9 7900 was extremely efficient at stock settings, consuming only 93W at full load with temperatures below 60 °C.
When increasing the TDP to 105W, a 12% performance gain was observed in Cinebench R20 for a 70% increase in power consumption, with a maximum temperature of tolerable 78 °C. Stretching the TDP further resulted in more than doubling the power consumption compared to stock settings, all for a mere 2% increase in performance over the 105W configuration, which is definitely not worth it.
In terms of acquisition cost, the Ryzen 9 7900 can be found on Amazon for around 419 USD, which is similar to the i7 13700K, perhaps its closest competitor and slightly superior in terms of performance, although consuming and dissipating more power as it. However, the Ryzen 9 7900 is an excellent option for scenarios where power consumption, heat dissipation, and multi-threaded performance are important factors. For example, in compact builds or on simpler motherboards with limited VRM capabilities, it is one of the best options in the market for these target audiences.


