Review – SSD Acer FA200 2TB – The Fastest QLC SSD We ever tested!
Today, we will test an ACER NVMe SSD from the top-of-the-line segment, the FA200 model, which Acer/Biwin sent us to test. Thank you 🙂
It comes in the M.2 format with a 64Gbps bus, meaning 4 PCIe 4.0 lanes, NVMe 2.0 protocol, and capacities ranging from 500GB to 4TB. Its price is around $99.
Specifications ACER FA200
Following are more detailed specifications about the SSD being tested (2TB unit):
SSD’s Software
These Acer SSDs come with a bundle including Acronis software for disk cloning and some additional functionalities. However, they do not have their own software for SSD operation, such as firmware updates.
Unboxing
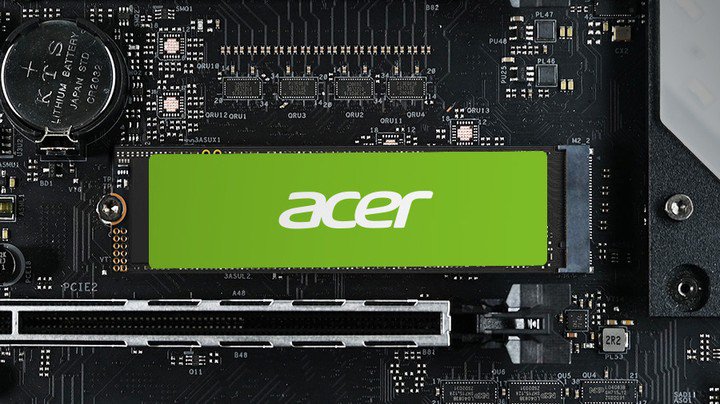
The product comes in white and green packaging, where the front features an illustrative image of the SSD containing only its capacity, warranty period, and some manufacturer seals. On the back, there are a few more brief information and descriptions of the SSD.
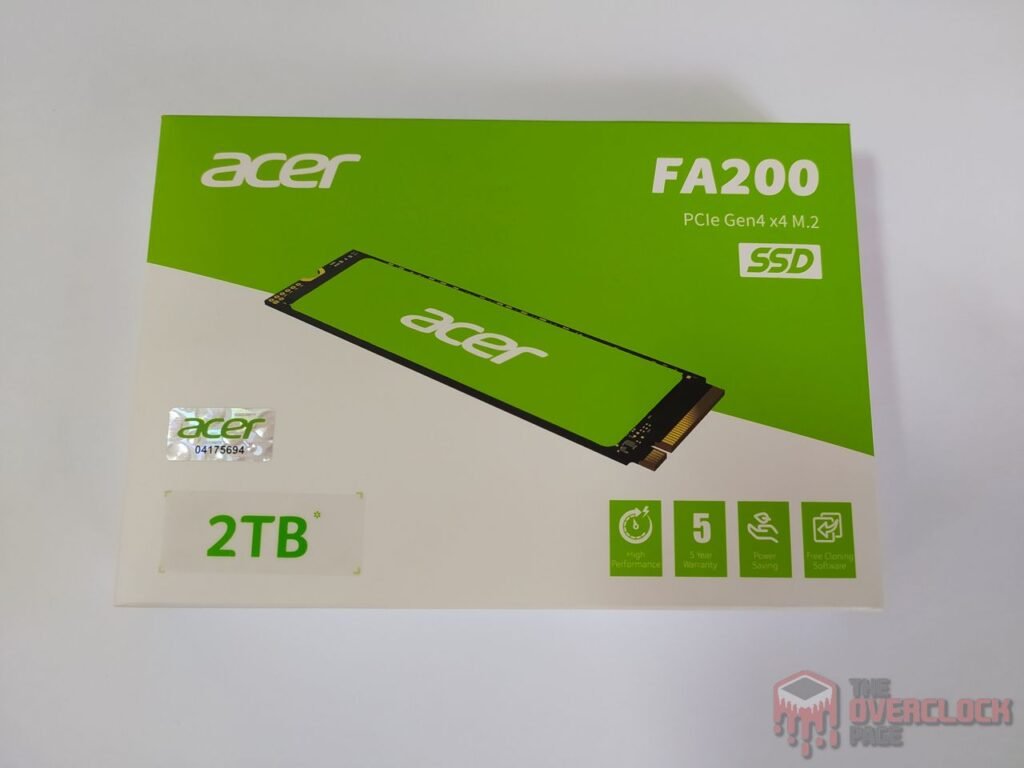
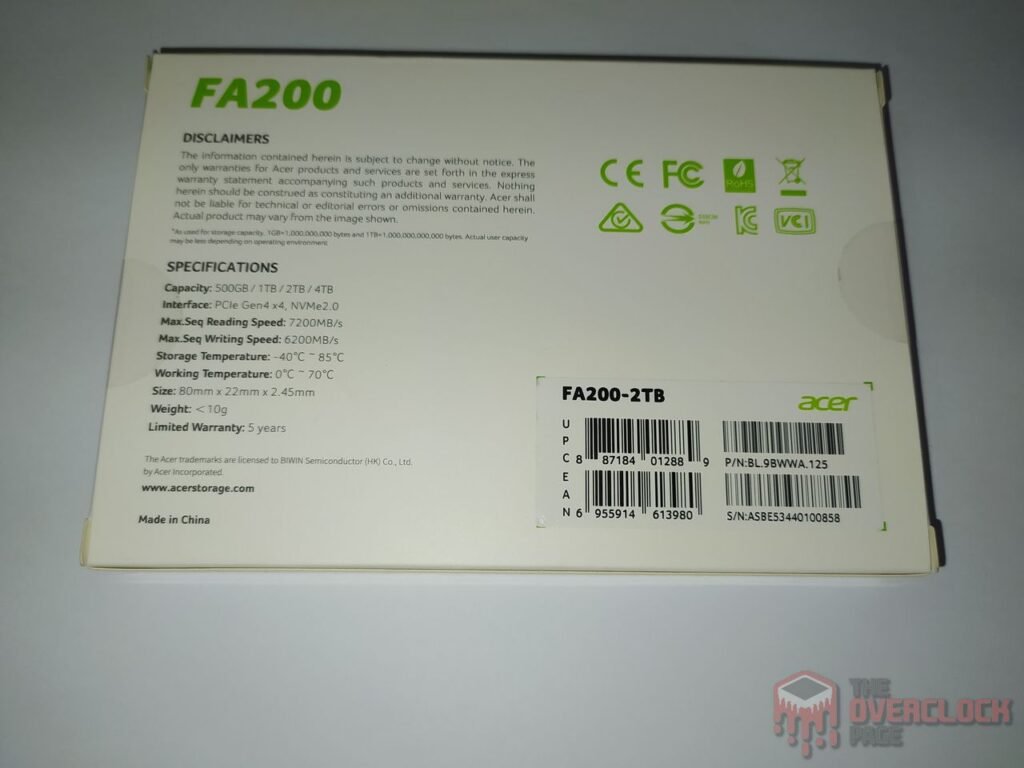
The SSD on its front side features a thin green adhesive paper, which may not contribute much to heat dissipation, but as we’ll see throughout the analysis, it wasn’t an issue. On the back, there are some product information and the serial number.
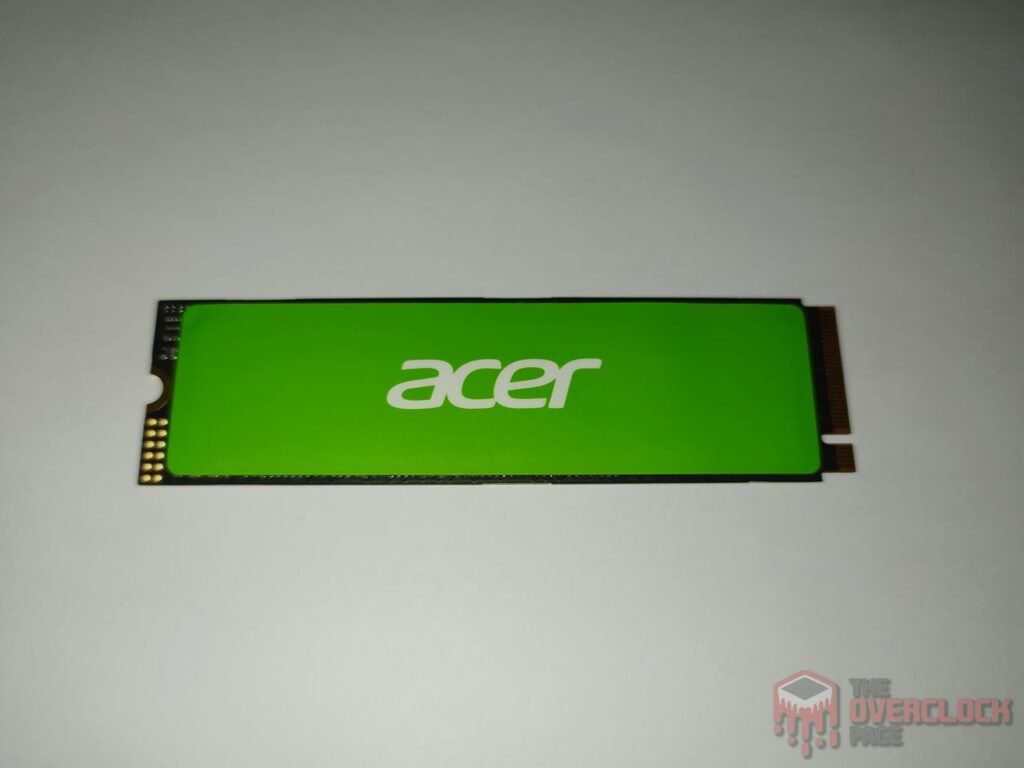
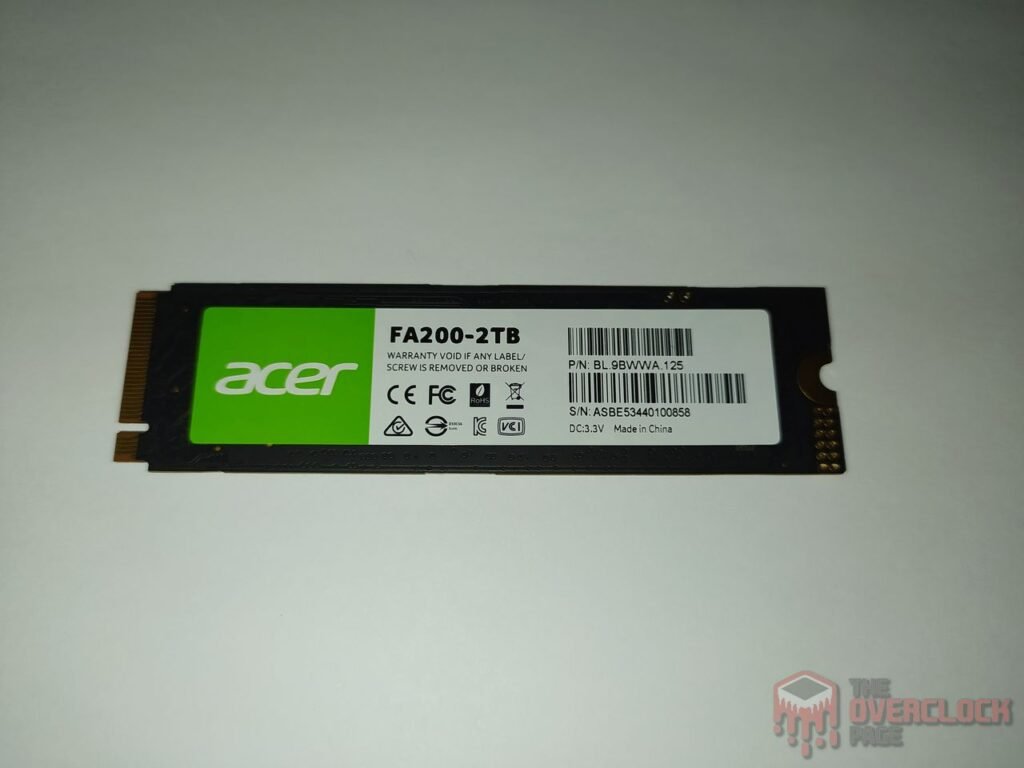
This SSD has a single-sided design, meaning it only has components on one side of the PCB, across all capacities, which facilitates the cooling of the SSD.
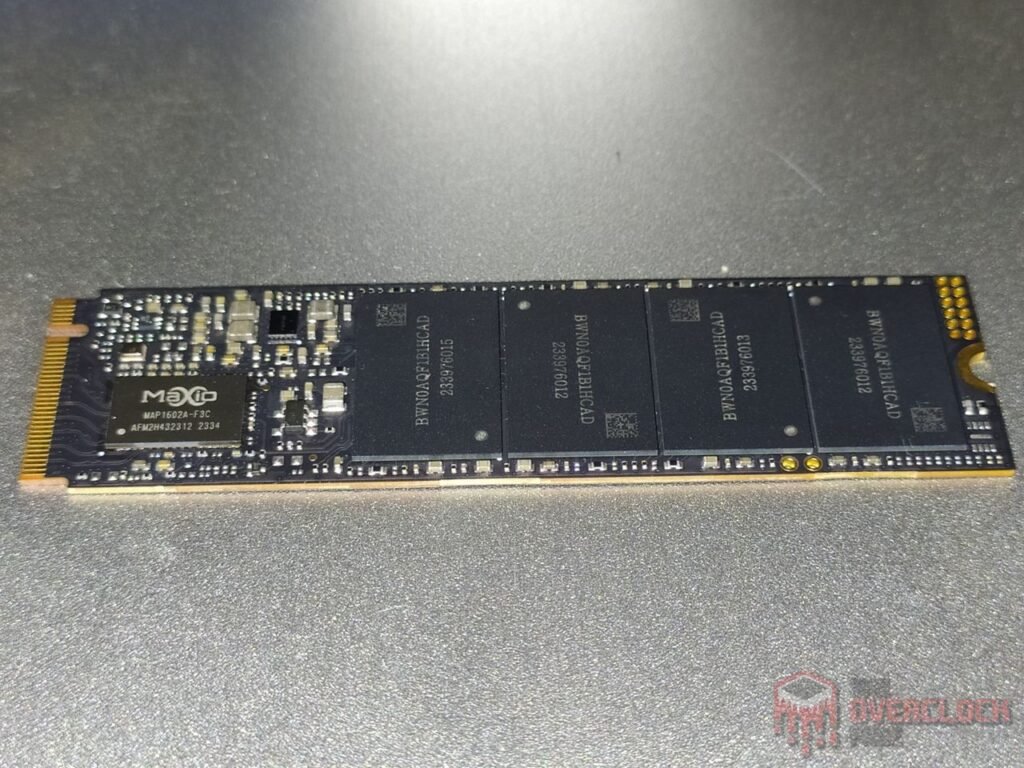
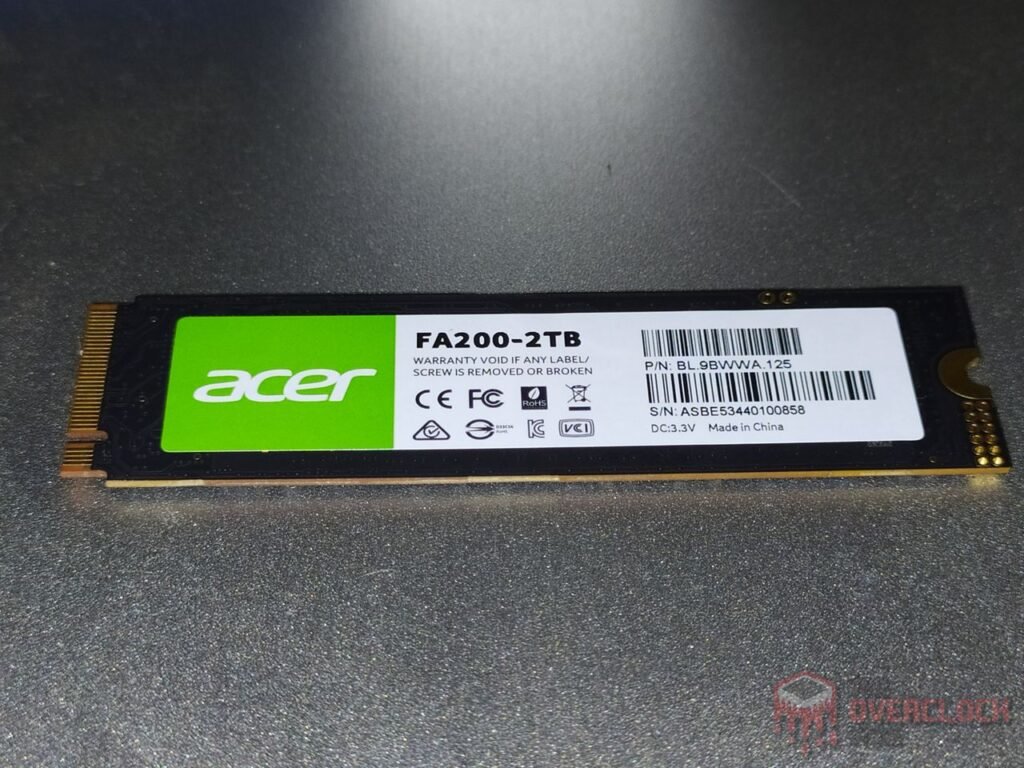
On its front PCB, we see the presence of its controller chip, 4 NAND Flash modules, as well as the PMIC and other VRM components.
Controller
The SSD controller is responsible for managing data, over-provisioning, garbage collection, among other background functions. And, of course, this contributes to the SSD’s good performance.
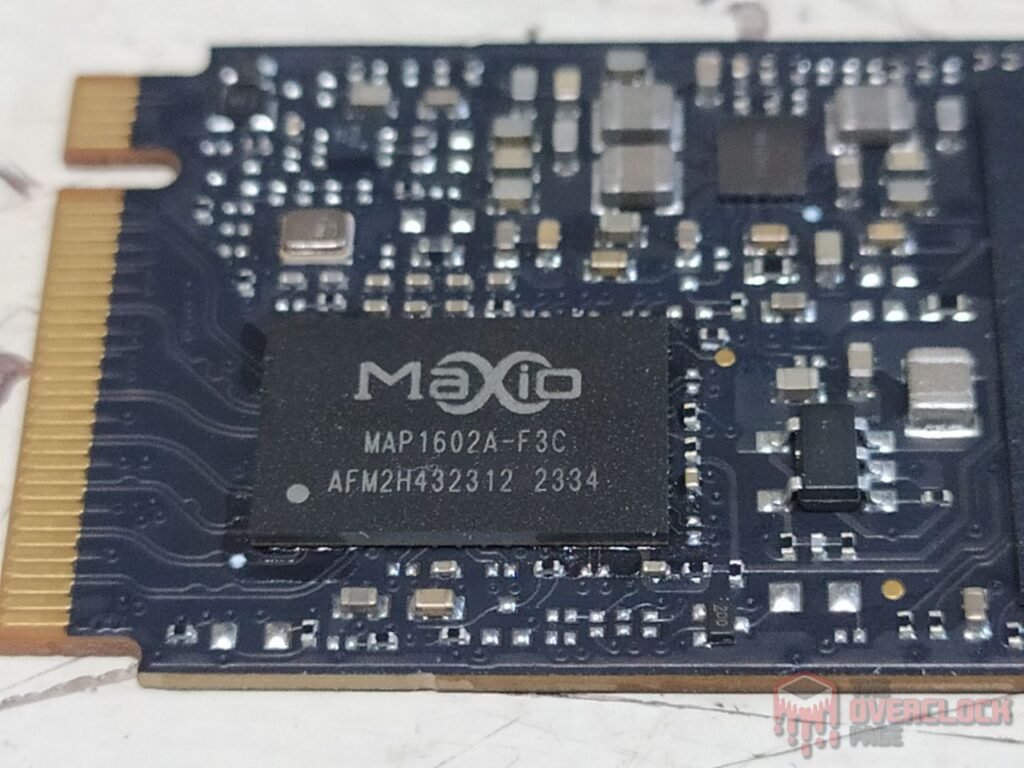
This SSD uses a controller from the manufacturer MaxioTech: the model MAP1602A. It’s an ISA ARM 32-bit quad-core Cortex® R5 controller with a 12nm manufacturing process from TSMC, similar to solutions from other well-known manufacturers in the market like Phison and Silicon Motion. This controller is DRAM-less, so it utilizes technologies like H.M.B. to store metadata tables.
In addition to this, it offers support for 4 communication channels with a bus speed of up to 2400 MT/s, which is a differentiating factor because many 4-channel Gen4 DRAM-less controllers typically support only up to 1600 MT/s. It provides support for up to 16 dies using “Chip enable” commands, which are direct and physically connected to the dies. As we will see shortly, its NAND Flash operates at 2400 MT/s.
DRAM Cache or H.M.B.
Every top-of-the-line SSD aiming to deliver high and consistent performance requires a buffer to store its mapping tables (Flash Translation Layer or Look-up table). With this, it can achieve better random performance and responsiveness.
As we mentioned, being a DRAM-Less controller, it does not support DRAM Cache. Therefore, to store the metadata table, it allocates 40 MiB of the system’s RAM to expedite access to this table.
NAND Flash
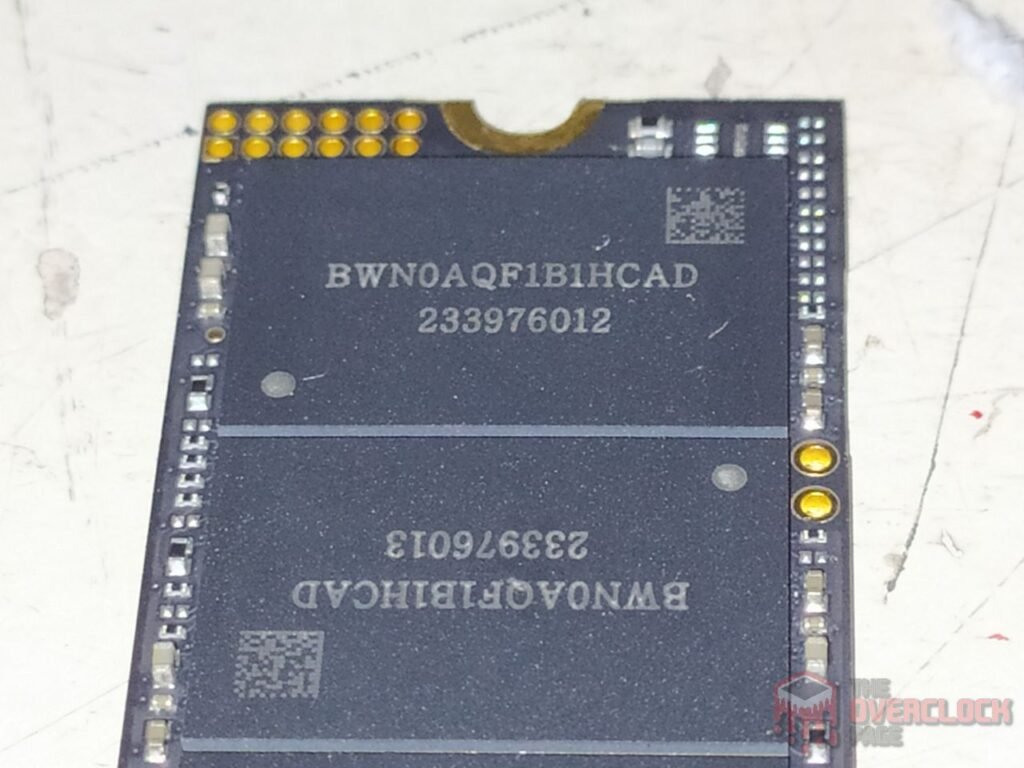
Regarding its integrated storage circuits, the 2TB SSD has 4 NAND flash chips labeled “BWN0AQF1B1HCAD” rebranded by BIWIN. This is because BIWIN is the official OEM that manufactures the PCBs of SSDs for both Acer and HP. These are NANDs from the Chinese manufacturer YMTC, X3-6070 QLC models in this case, with dies of 1Tb (128GB) containing 232 layers of data and a total of 253 gates, resulting in an array efficiency of 91.7%. Out of the 253 layers of the SSD, 232 are allocated for storage, contributing to this efficiency.
In this SSD, each NAND Flash consists of 4 dies with a density of 1Tb, totaling 512GB per NAND, resulting in a total of 2TB. They communicate with the controller using their maximum bus speed of 2400 MT/s for better performance.
Each of these dies has 4 planes so that when the controller accesses each die, it can increase parallelism and thus improve performance. These new QLC dies from YMTC, up to the moment of analysis, are among the fastest QLC dies available.
PMIC (Power Delivery)
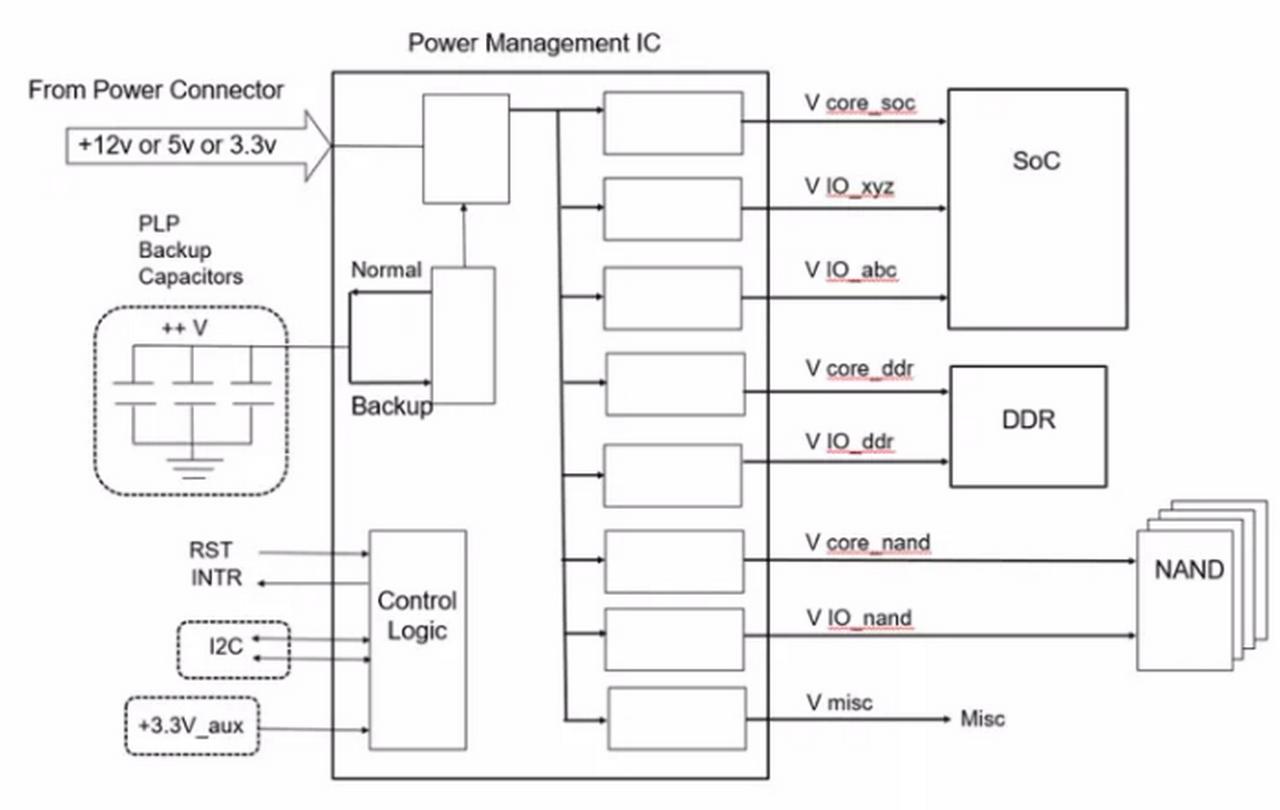
Just like any electronic component that performs work, SSDs also have a power consumption level that can vary from a few milliwatts to close to 10 watts, nearing the limit of some connectors or slots. The circuit responsible for all power management is the PMIC, which stands for “Power Management IC,” a chip responsible for providing power to other components.
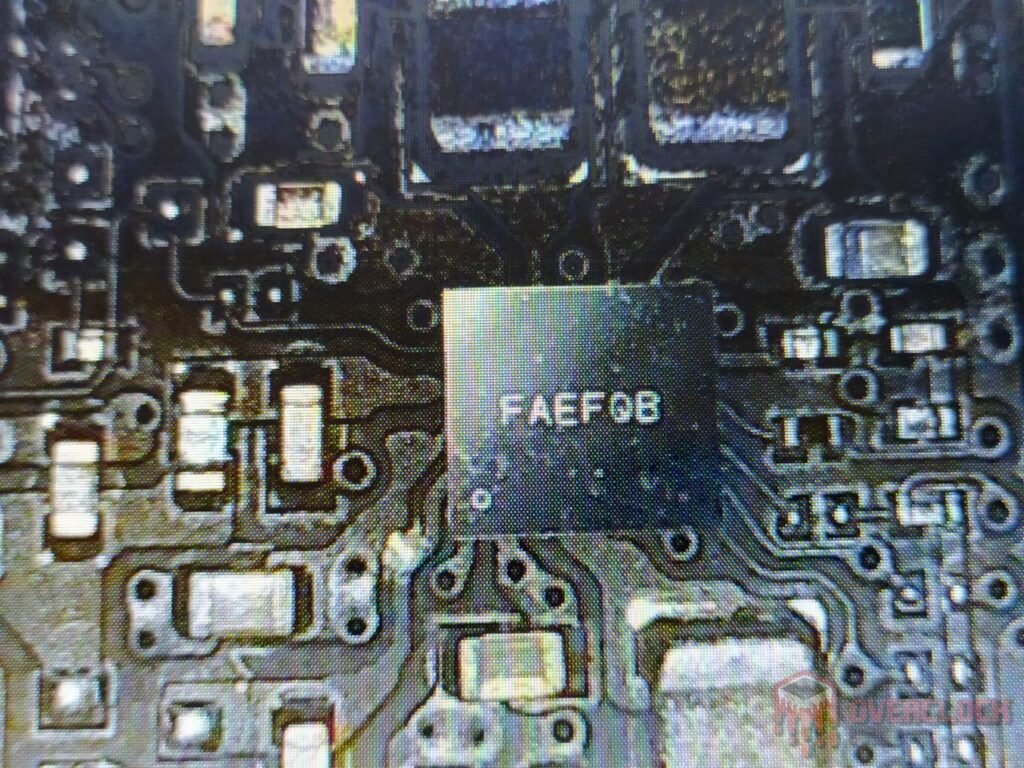
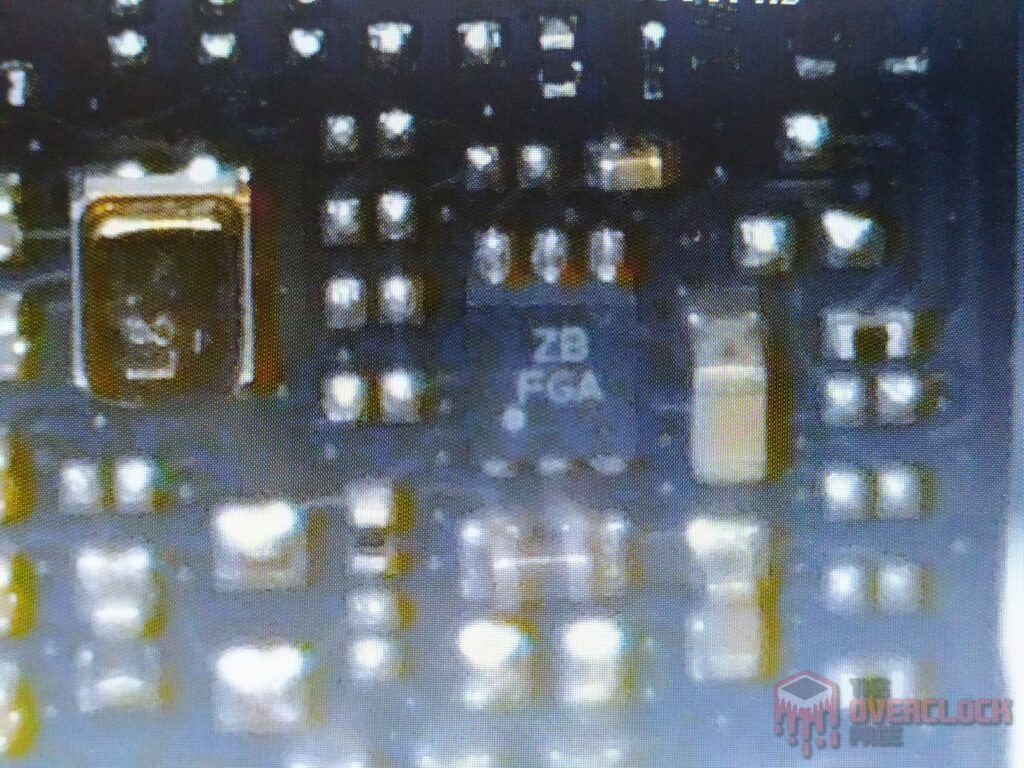
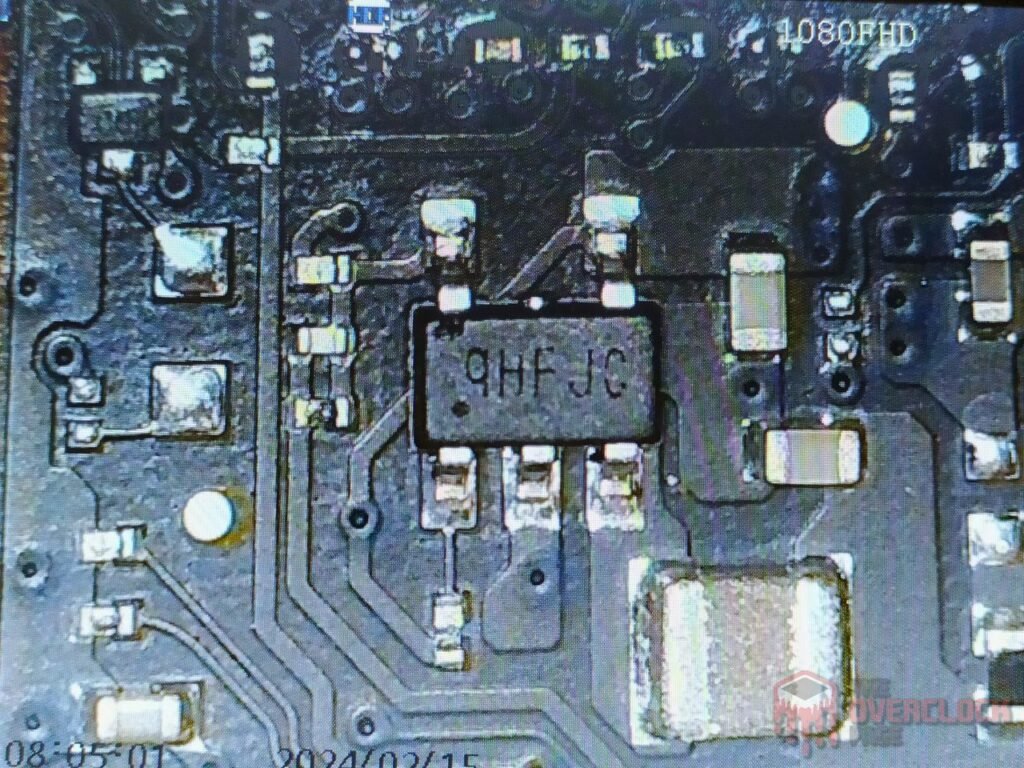
In this SSD, it utilizes the renowned PMIC marked as 9HFJC, which is a Step-down Regulator operating with a switching frequency of up to 1.5MHz, providing 2A of current, and supports operation within a voltage range of 2.5V to 5.5V.
It manages to maintain good efficiency when providing 1A and 3.3V, which is typical for this SSD as we will see throughout the analysis, where it stayed close to that.
The “ZB” could be either the ONsemi NCP4587DMX33TCG or the Ricoh RP201K331D, both of which are linear voltage regulators.
SSD Power States
As we always mention in power consumption analyses, in this section, we’ll delve into the power states of this SSD.
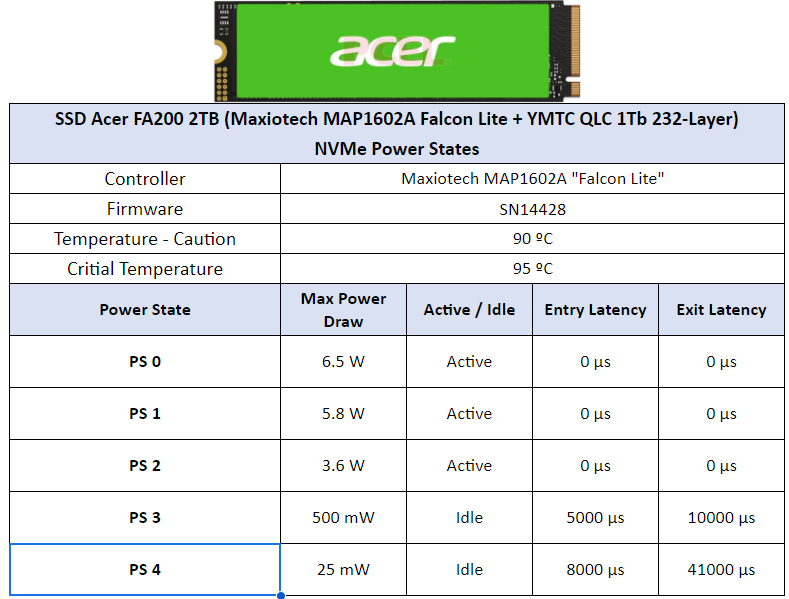
Of the 5 power states it has, there are 3 active states with excellent latencies and 2 idle states with higher latencies. Another curious aspect to note is that the manufacturer decided to configure the SSD with a rather high thermal throttling temperature, in the range of 90°C to 95°C, but as we will see throughout the analysis, it doesn’t even come close to reaching that temperature.
CURIOSITIES ABOUT ACER FA200
Just as integrated circuits in RAM modules undergo variation, the same happens with SSDs, where there are cases of component changes such as controllers and NAND flash chips.
Up to the moment of this analysis, it hasn’t been possible to find other variants of this same SSD. However, it is possible to notice that this SSD and the HP FX700 have identical construction because Biwin manufactures SSDs for both Acer/Predator and HP.
TEST BENCH
– OS: Windows 11 Pro 64-bit (Build: 23H2)
– CPU: Intel Core i7 13700K (5.7GHz all core) (E-cores e Hyper-threading desabled)
– RAM: 2 × 16 GB DDR4-3200MHz CL-16 Netac (c/ XMP)
– Motherboard: MSI Z790-P PRO WIFI D4 (Bios Ver.: 7E06v18)
– GPU: RTX 4060 Galax 1-Click OC (Drivers: 537.xx)
– (OS Drive): SSD Solidigm P44 Pro 2TB (Firmware: 001C)
– DUT SSD: SSD ACER FA200 2TB (Firmware: SN14428)
– Chipset Driver Intel Z790: 10.1.19376.8374.
– Windows: Indexing disabled to avoid affecting test results.
– Windows: Windows updates disabled to avoid affecting test results
– Windows: Most Windows applications disabled from running in the background.
– Boot Windows: Clean Image with only Drivers
– Test pSLC Cache: The SSD is cooled by fans to prevent thermal throttling, ensuring it doesn’t interfere with the test results.
– Windows: Antivirus disabled to minimize variation in each round.
– DUT SSDs: Used as a secondary drive, with 0% of space being utilized, and other tests conducted with 50% of space utilized to represent a realistic scenario.
– Quarch PPM QTL1999 – Power consumption test: conducted with three parameters—idle, where the drive is left as a secondary, and after a period of idle, a one-hour write test is performed, and the average power consumption is recorded
WHERE TO BUY
This SSD can currently only be found in the USA; however, at the time of this review, it hasn’t been possible to locate it for sale.
CRYSTALDISKMARK
We conducted synthetic sequential and random tests with the following configurations:
Sequential: 2x 1 GiB (Blocks 1 MiB) 8 Queues 1 Thread
Random: 2x 1 GiB (Blocks 4 KiB) 1 Queue 1/2/4/8/16 Threads
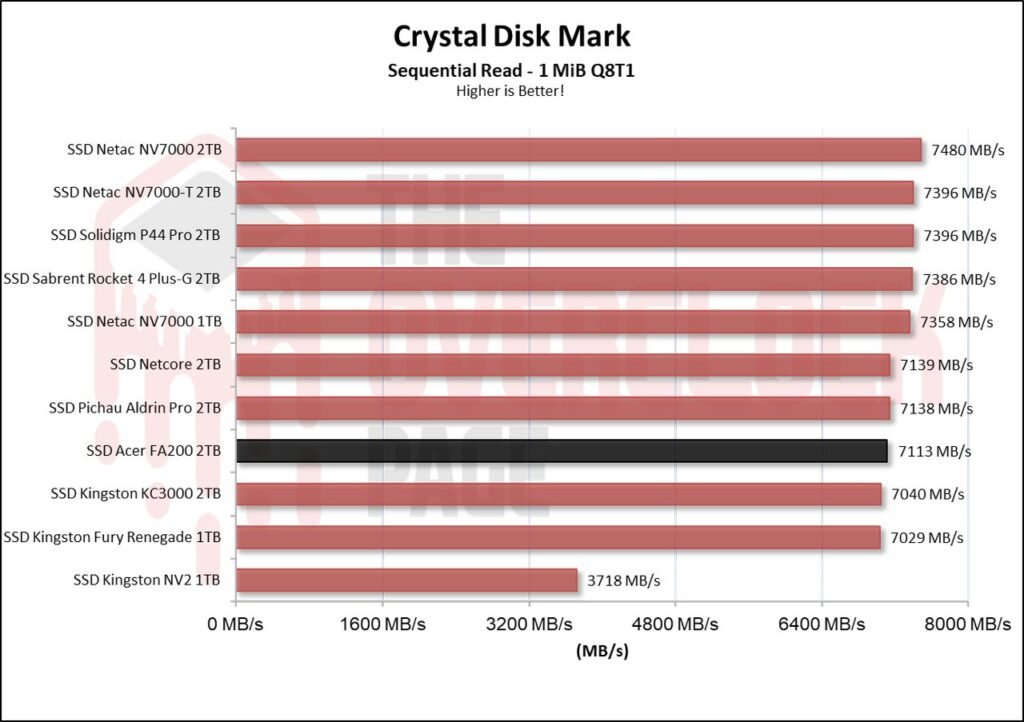
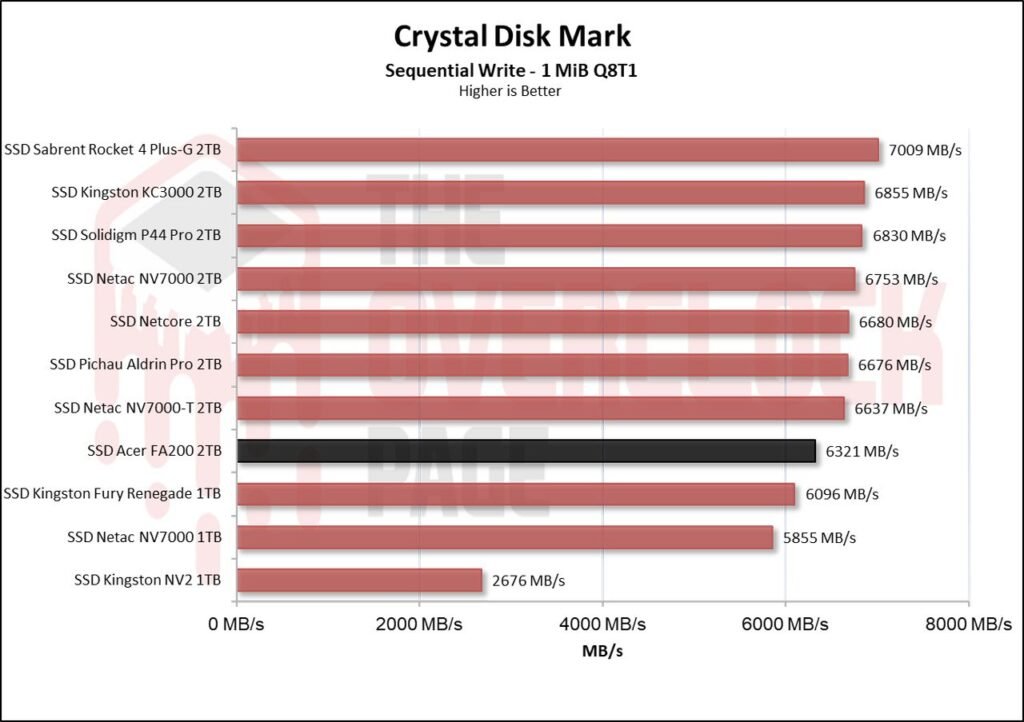
We see that in sequential speed tests, it delivers what it promises and performs identically to other Gen4 SSDs. The interesting aspect is observing a “mere” 2TB QLC SSD behaving like a high-performance Gen4 TLC SSD. Previously, other Gen4 QLC SSDs hovered around 5000 MB/s. However, thanks to these new QLC dies, they are quite fast in reaching this bandwidth.
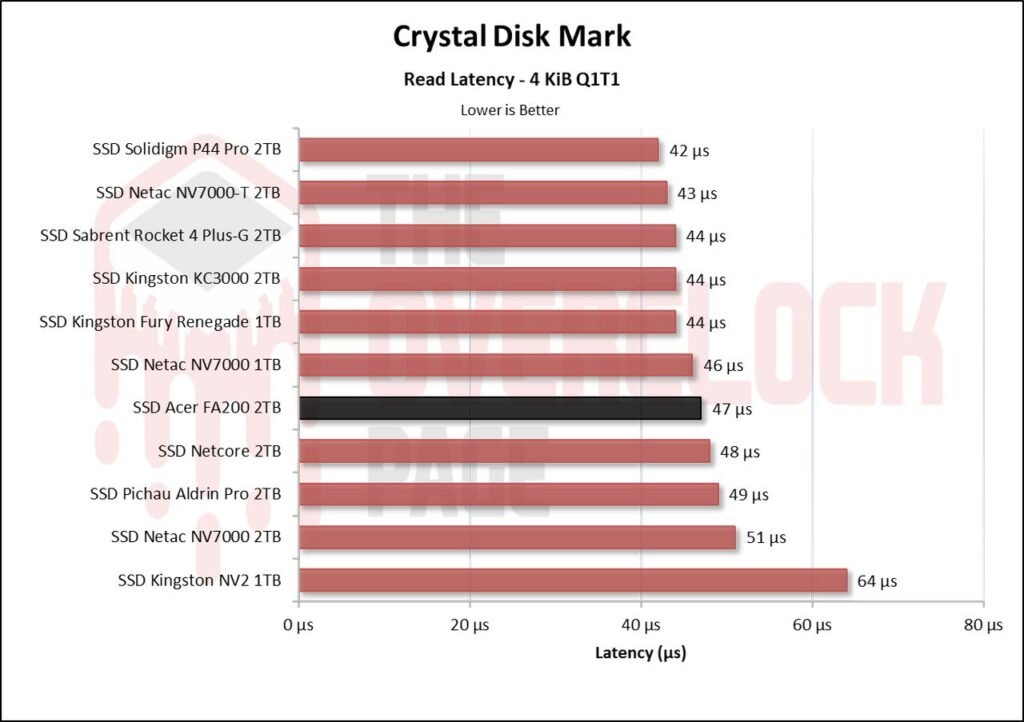
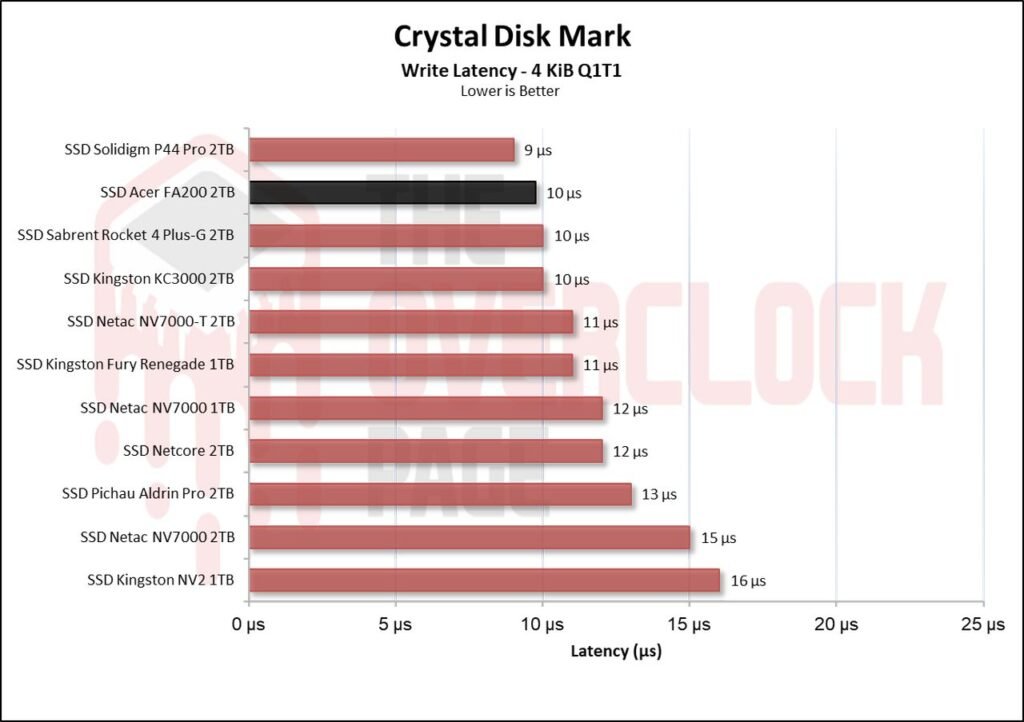
In terms of latency, once again, we see that it delivers excellent results, especially in its write performance.
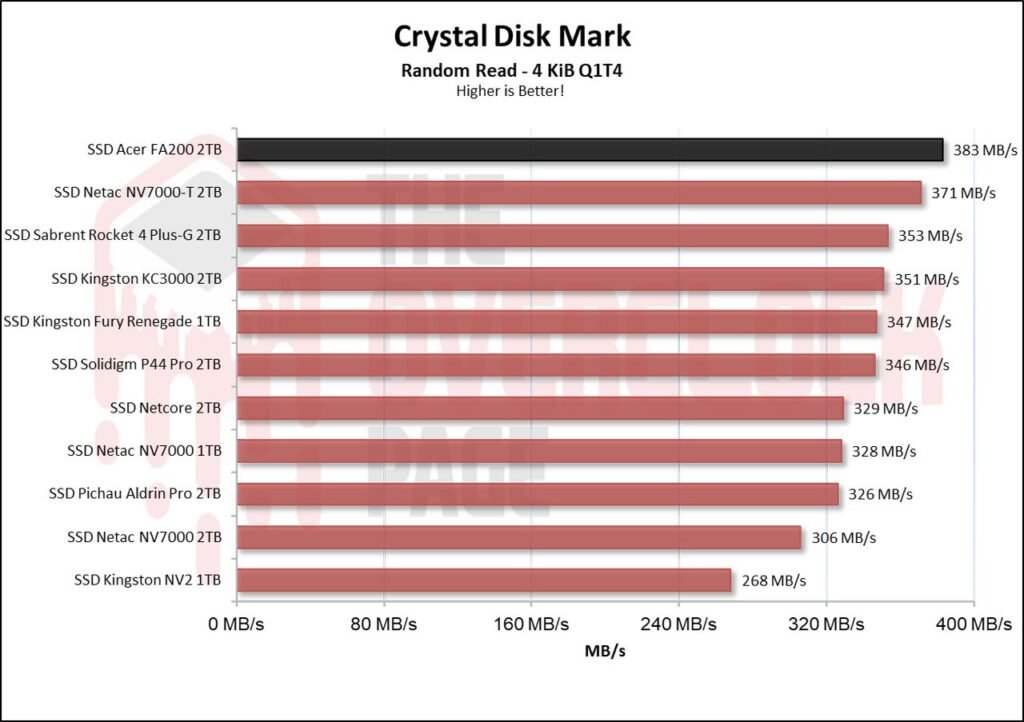
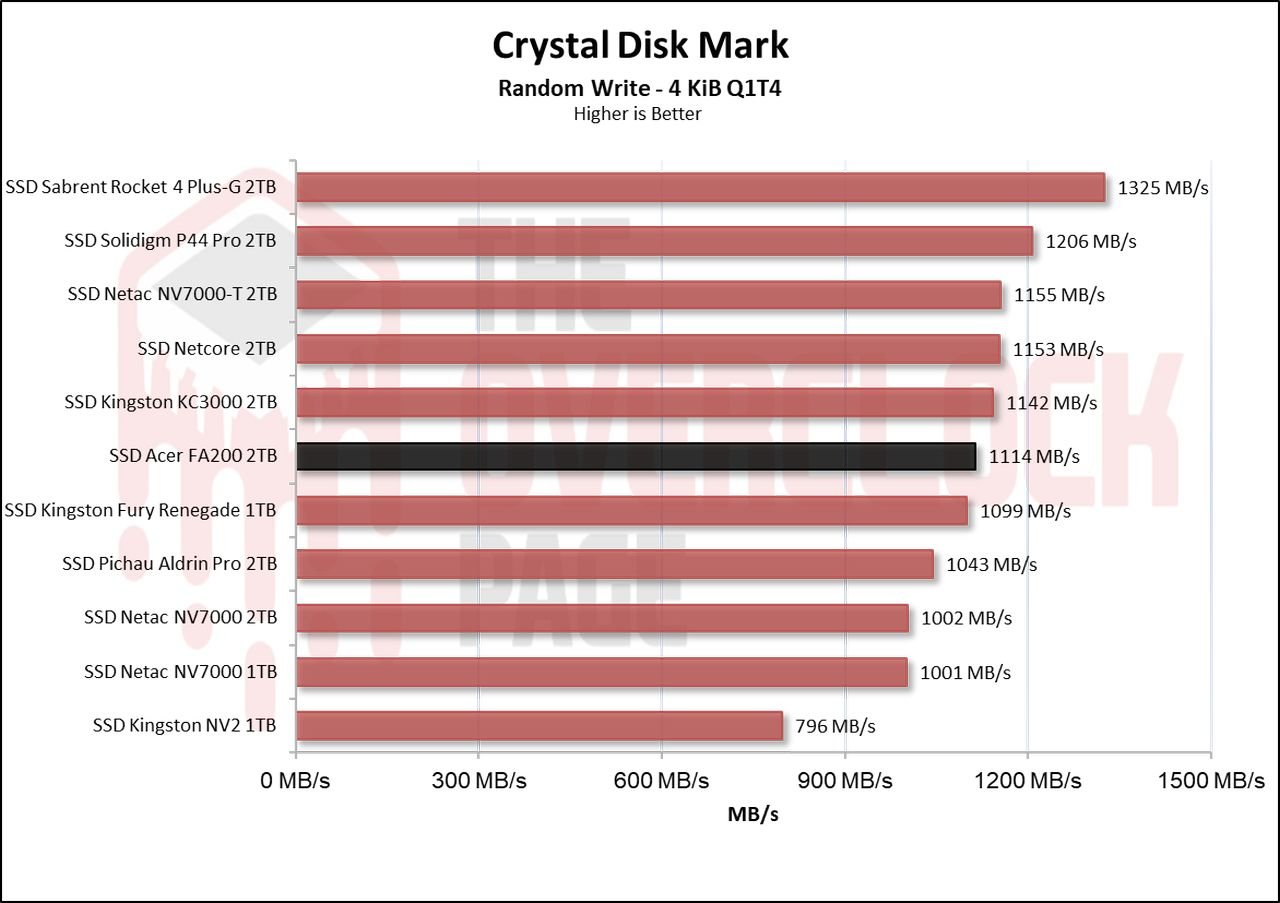
When testing its random speeds at a queue depth of 4, we see that in its reading, it was the fastest SSD in the comparison, which is an incredible result for a QLC SSD. Meanwhile, in its writing, it even outperformed SSDs with Phison E18 + B47R.
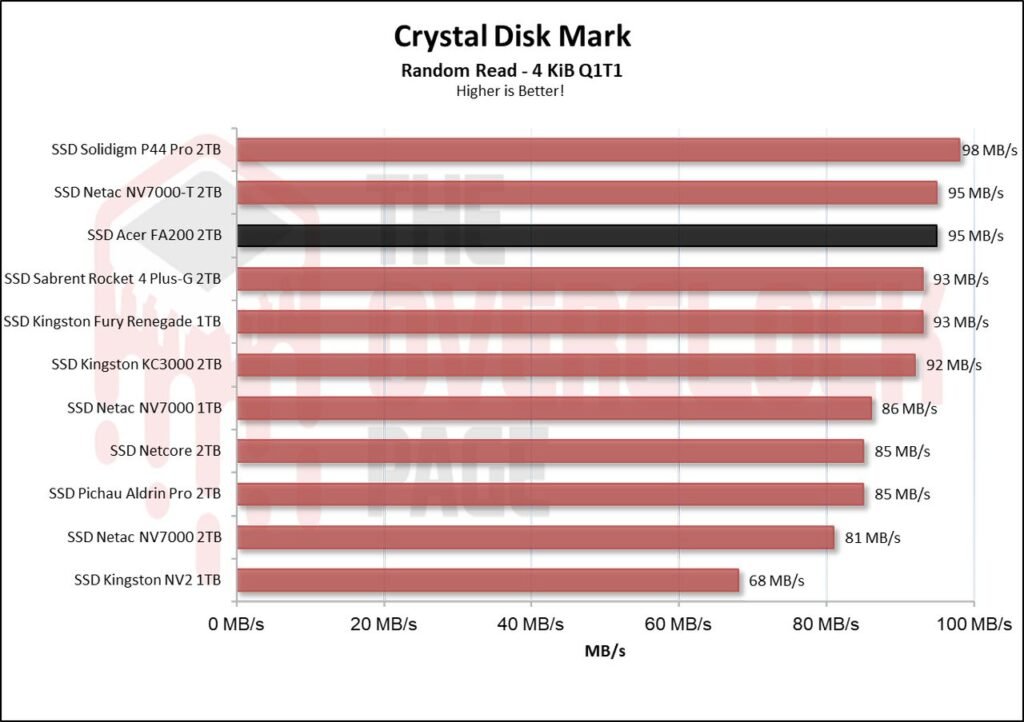
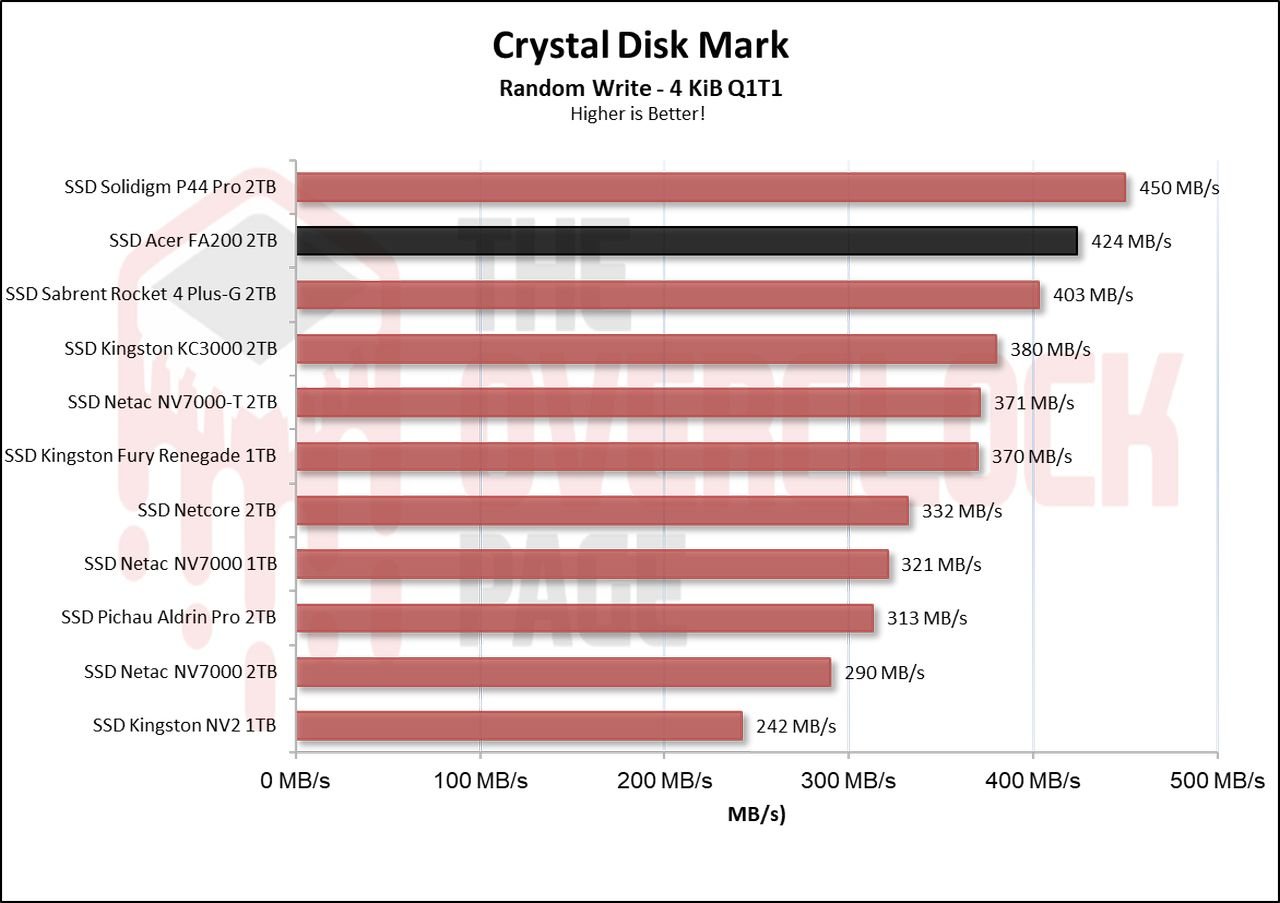
When allocating just 1 thread to better represent a typical everyday workload, we observe the same result: its reading was similar to the NV7000-T with a similar construction, albeit TLC. Meanwhile, in its writing, it was the second-best SSD in the comparison, but it’s important to note that this occurs in the SLC Cache region of the SSD.
ATTO Disk Benchmark QD1 e QD4
We conducted a test using ATTO to observe the speed of the SSDs at different block sizes. In this benchmark, it was configured as follows:
Blocks: 512 Bytes up to 8 MiB
File Size: 256MB
Queue Depth: 1 e 4.
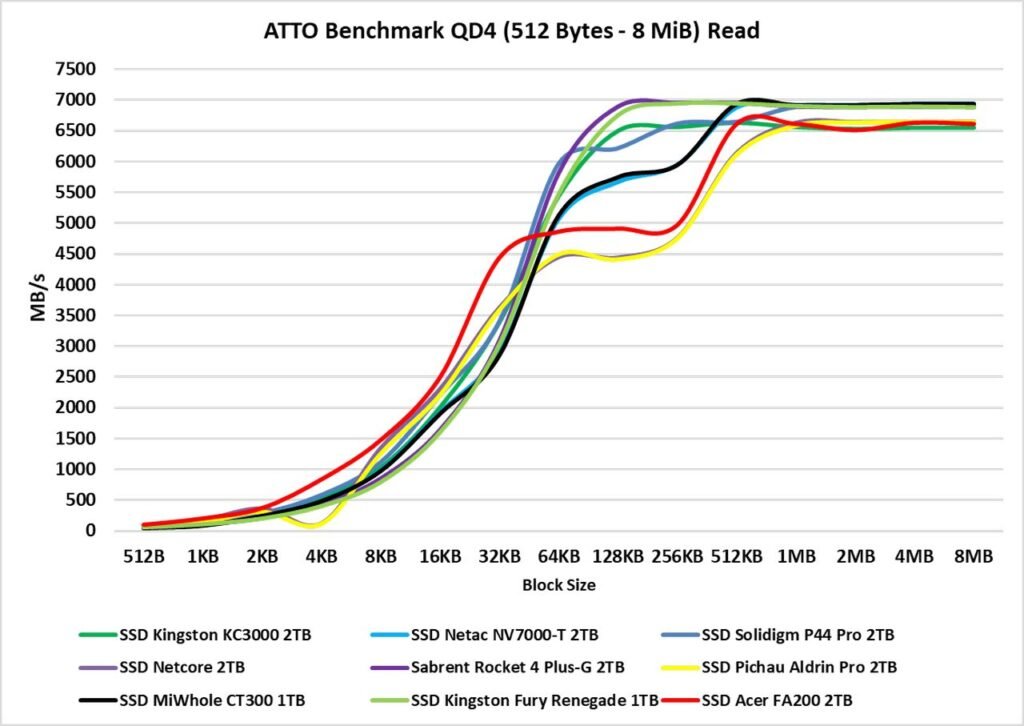
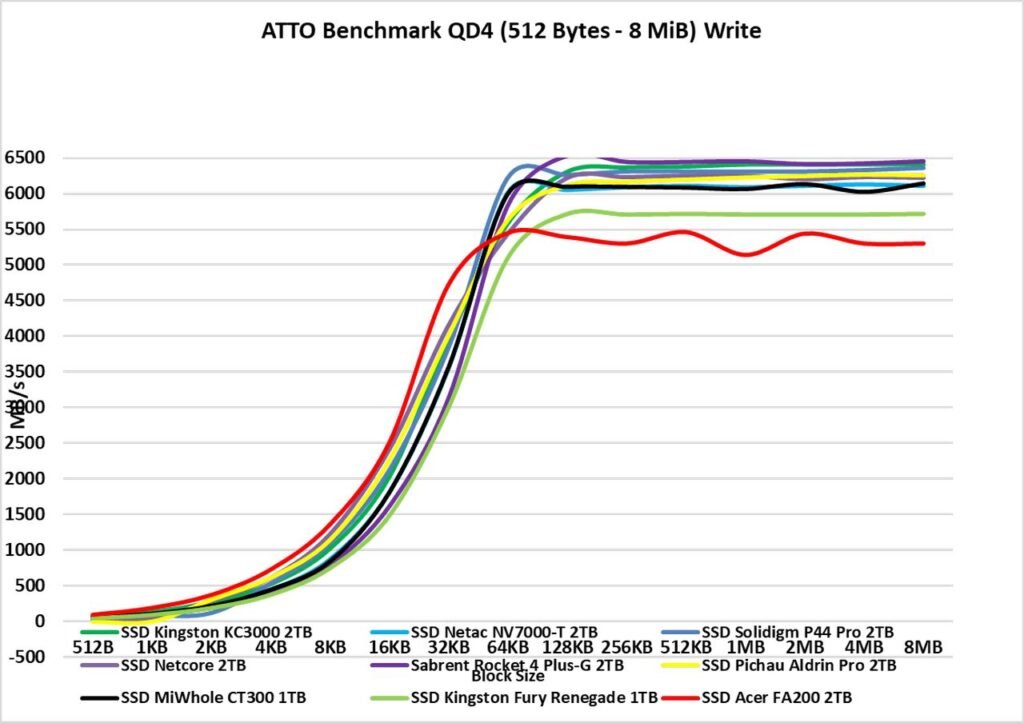
The ATTO Disk Benchmark is a software that performs a sequential speed test with compressed files, simulating a data transfer load as in Windows. Typically, we observe performance around block sizes of 128KB to 1 MiB. Now, in reading, we see that no SSD could match its performance with small blocks up to 32 KB; it was only surpassed from 32 KB onwards. The same occurred in writing, but up to 64 KB.
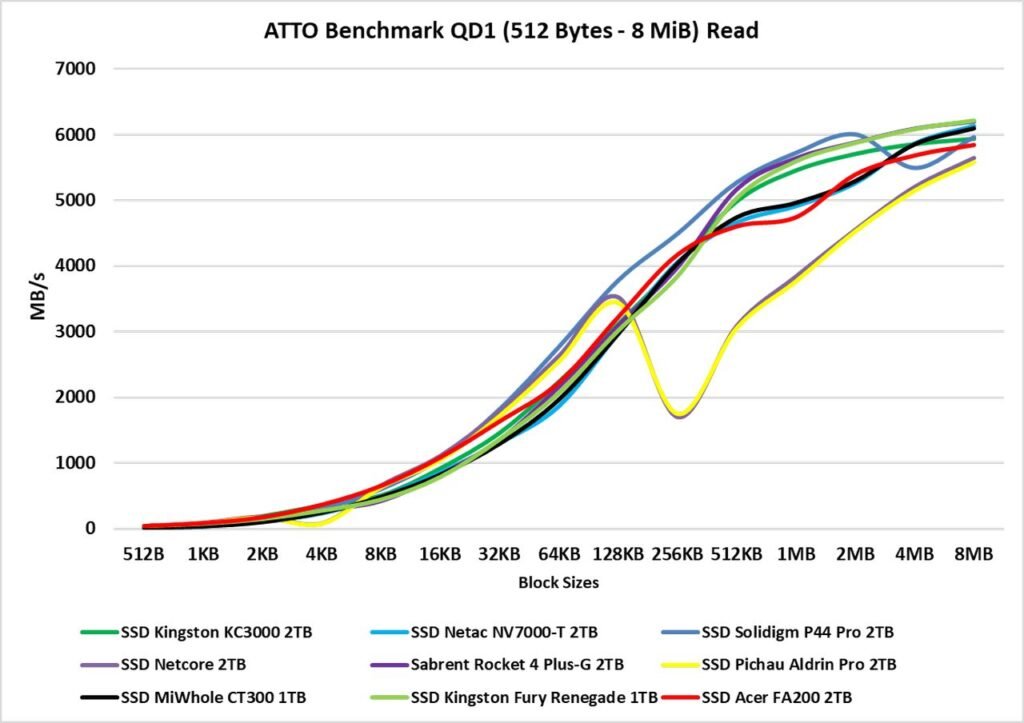
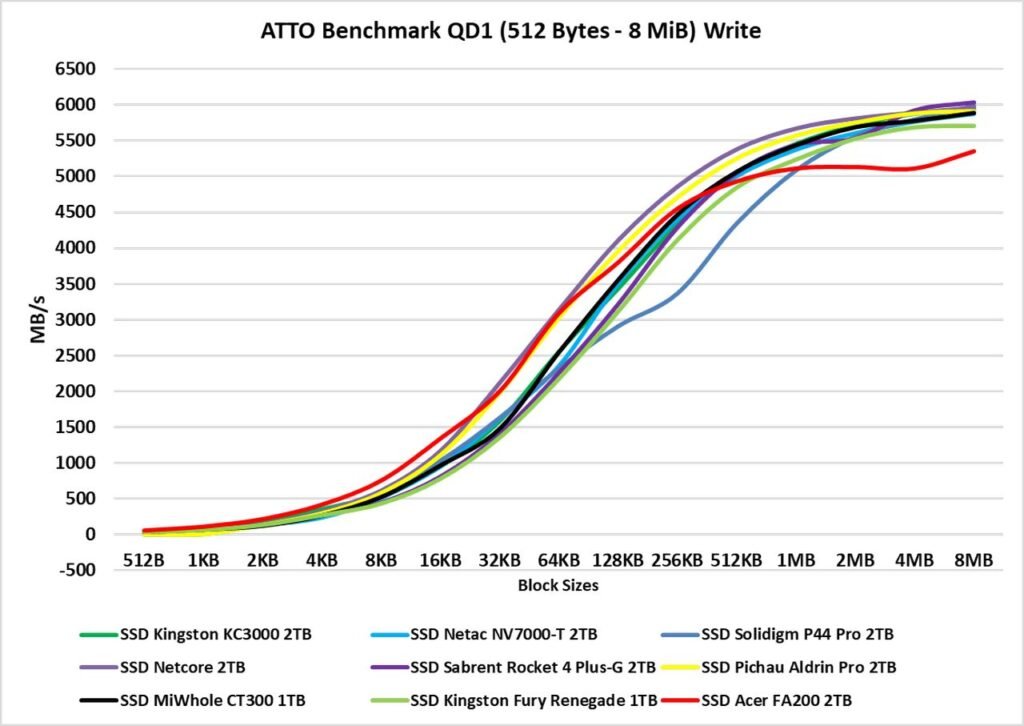
At a queue depth of 1, in its reading, we see that it starts ahead but then ends up following the pace of the other SSDs in the comparison. In its writing, it behaved similarly to its reading.
3DMark – Storage Benchmark
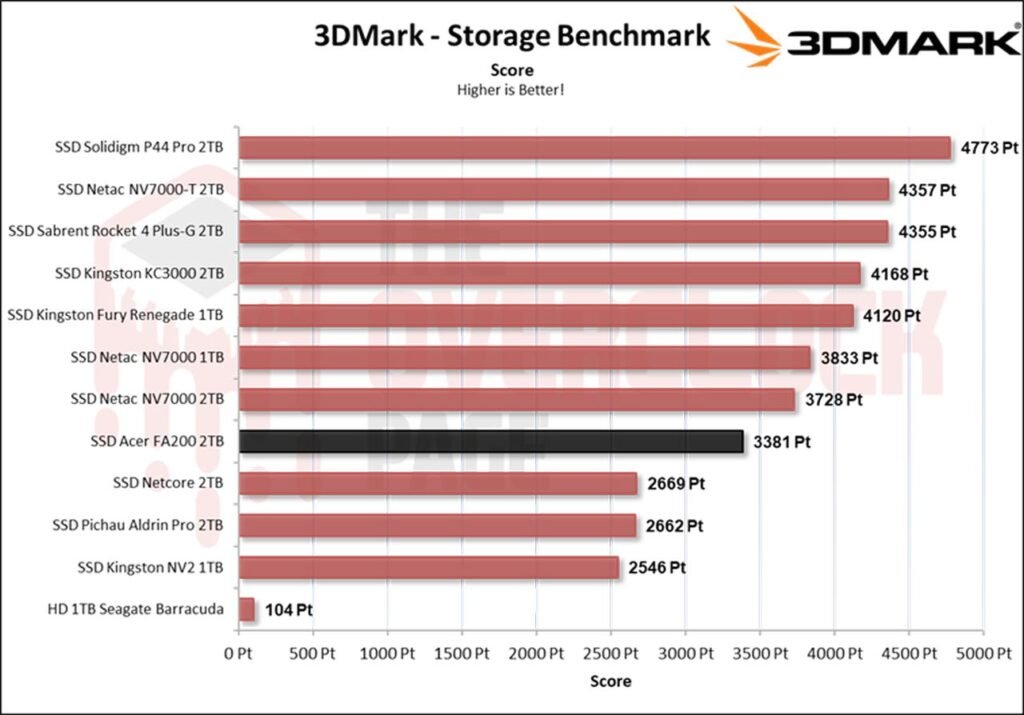
In this benchmark, various storage-related tests are conducted, including game loading tests such as Call of Duty Black Ops 4, Overwatch, recording and streaming with OBS of a gameplay at 1080p 60 FPS, installation of some games, and file transfers of game folders.
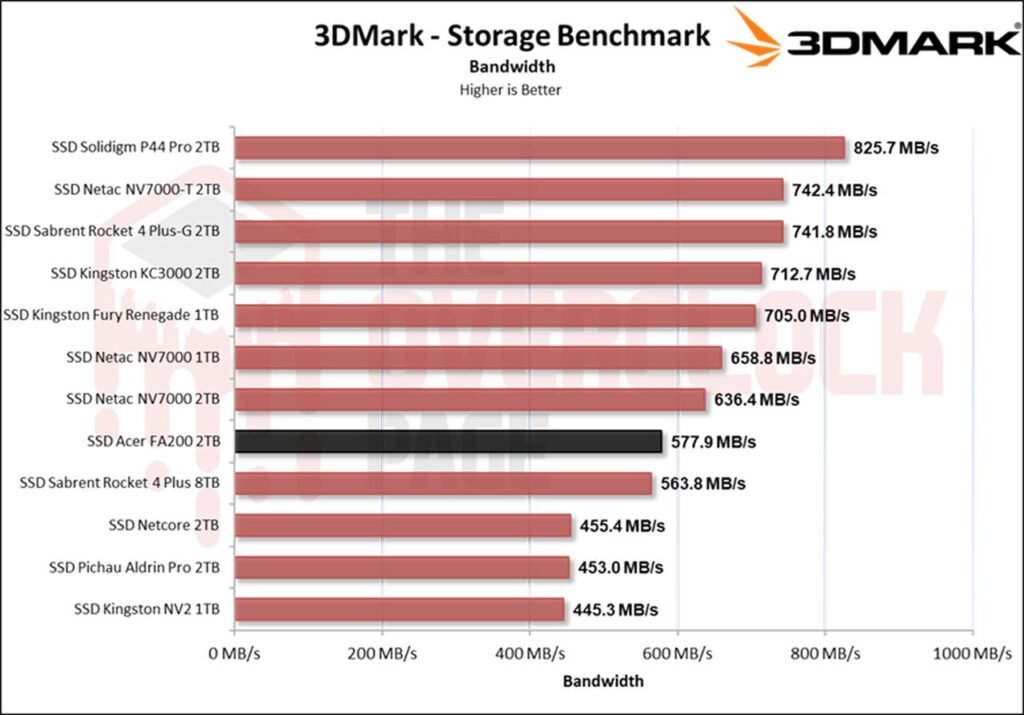
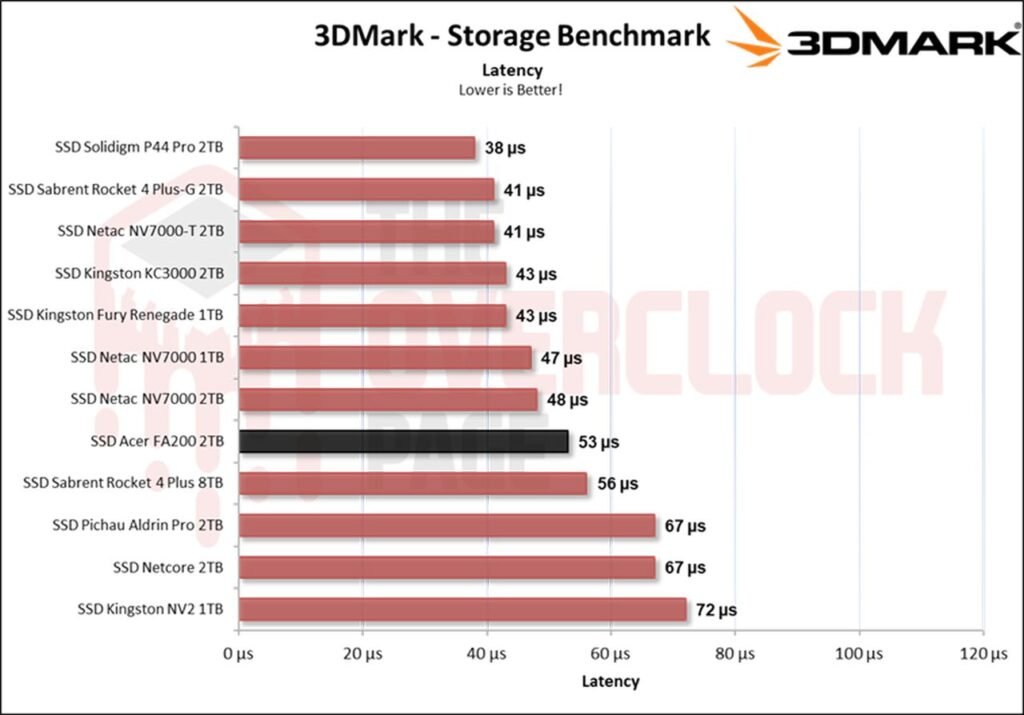
In this benchmark focusing more on casual environments such as game simulation and streaming among other simulations, we can observe that although it wasn’t the fastest SSD in the comparison, it performs well for a QLC SSD, surpassing other drives like some SSDs with IG5236 + YTMC CDT1B.
PCMARK 10 – FULL SYSTEM DRIVE BENCHMARK
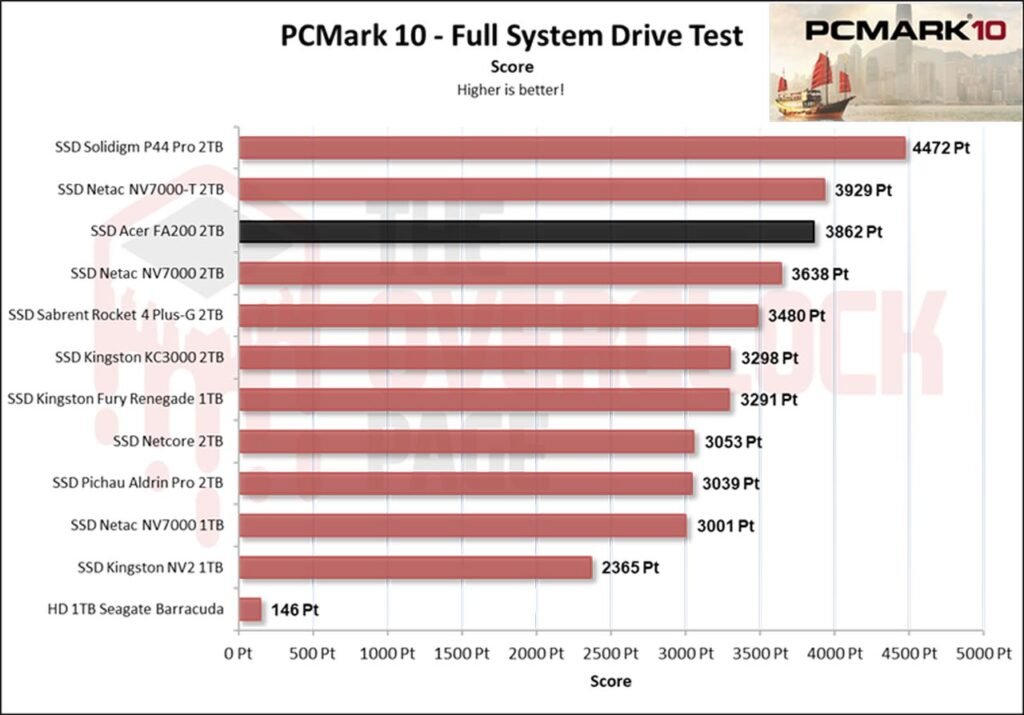
In this test, the Storage Test tool was used, specifically the “Full System Drive Benchmark,” which conducts both light and heavy tests on the SSD.
Among these traces, we can observe tests such as:
- Boot Windows 10
- Adobe After Effects: Launch the application until it is ready for use
- Adobe Illustrator: Launch the application until it is ready for use
- Adobe Premiere Pro: Launch the application until it is ready for use
- Adobe Lightroom: Launch the application until it is ready for use
- Adobe Photoshop: Launch the application until it is ready for use
- Battlefield V: Loading time until the main menu
- Call of Duty Black Ops 4: Loading time until the main menu
- Overwatch: Loading time until the main menu
- Using Adobe After Effects
- Using Microsoft Excel
- Using Adobe Illustrator
- Using Adobe InDesign
- Using Microsoft PowerPoint
- Using Adobe Photoshop (Intensive use)
- Using Adobe Photoshop (Lighter use)
- Copying 4 ISO files, a total of 20GB, from a secondary drive (Write test)
- Performing the copy of the ISO file (Read-write test)
- Copying the ISO file to a secondary drive (Read)
- Copying 339 JPEG files (Photos) to the tested drive (Write)
- Creating copies of these JPEG files (Read-write)
- Copying 339 JPEG files (Photos) to another drive (Read)
In this scenario, which is a practical benchmark with a slightly greater focus on writing than the 3DMark, here we can indeed see that it performed very well, as it almost matched the NV7000-T, which is a very fast TLC SSD.
Adobe Premiere Pro 2021
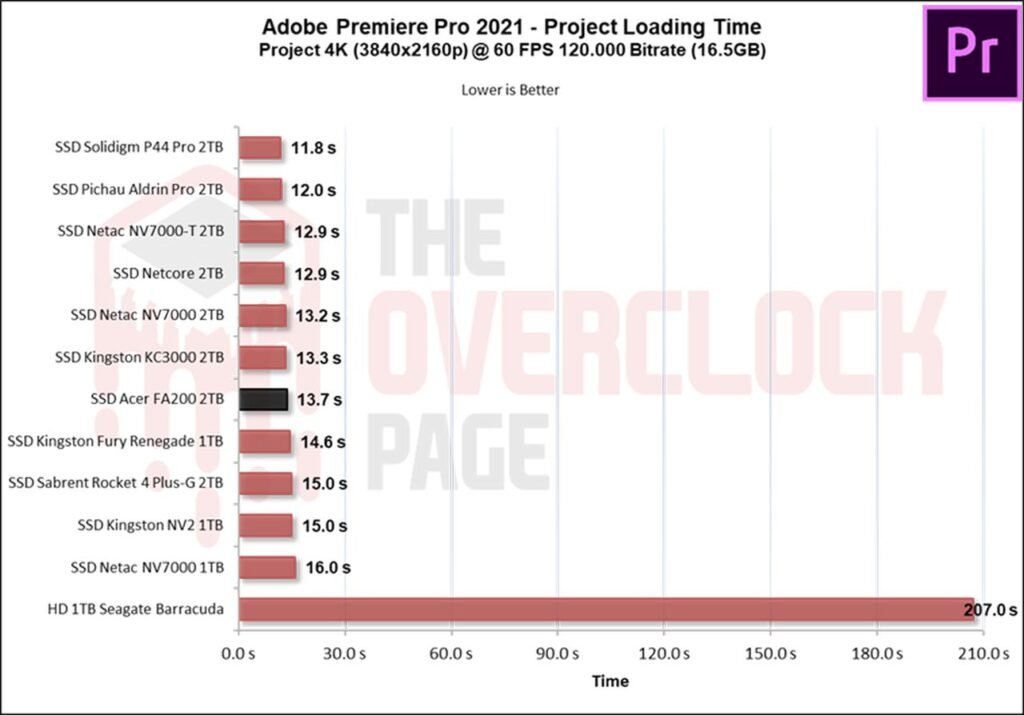
Following that, we utilized Adobe Premiere to measure the average time it took to open a project of approximately 16.5GB with a 4K resolution, 120Mbps bitrate, filled with effects until it was ready for editing. It’s important to note that the tested SSD is always used as a secondary drive without the operating system installed, as this could potentially affect the result and lead to inconsistencies.
When using Premiere to load a project of over 16GB, we see that the difference between it and the KC3000 was very small, which is a great result.
GAME LOADING TIME AND BOOT TIME
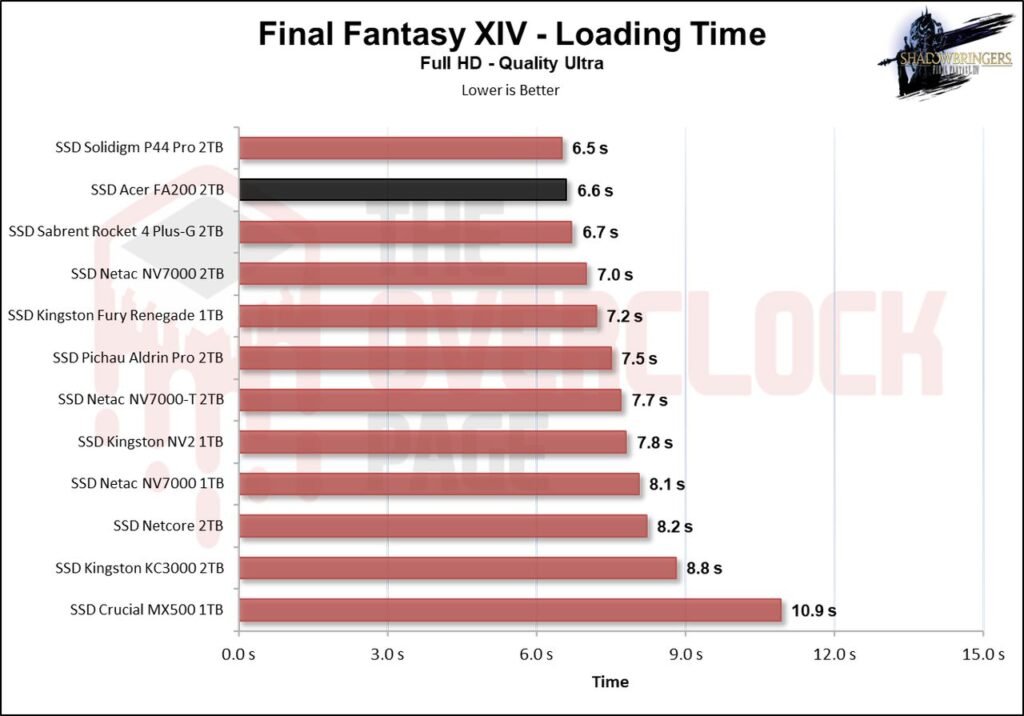
We conducted a comparison between multiple SSDs and a HDD using a clean installation of Windows 10 Build 21H1 along with the Final Fantasy XIV benchmark opening the campaign mode. The test consists of the best result after three consecutive system boots, considering the total time until reaching the desktop with the score reported by the application. Therefore, it is slower than the boot until the desktop screen appears.
Now, when testing game loading times like this, we see once again that it performs very well, another positive point.
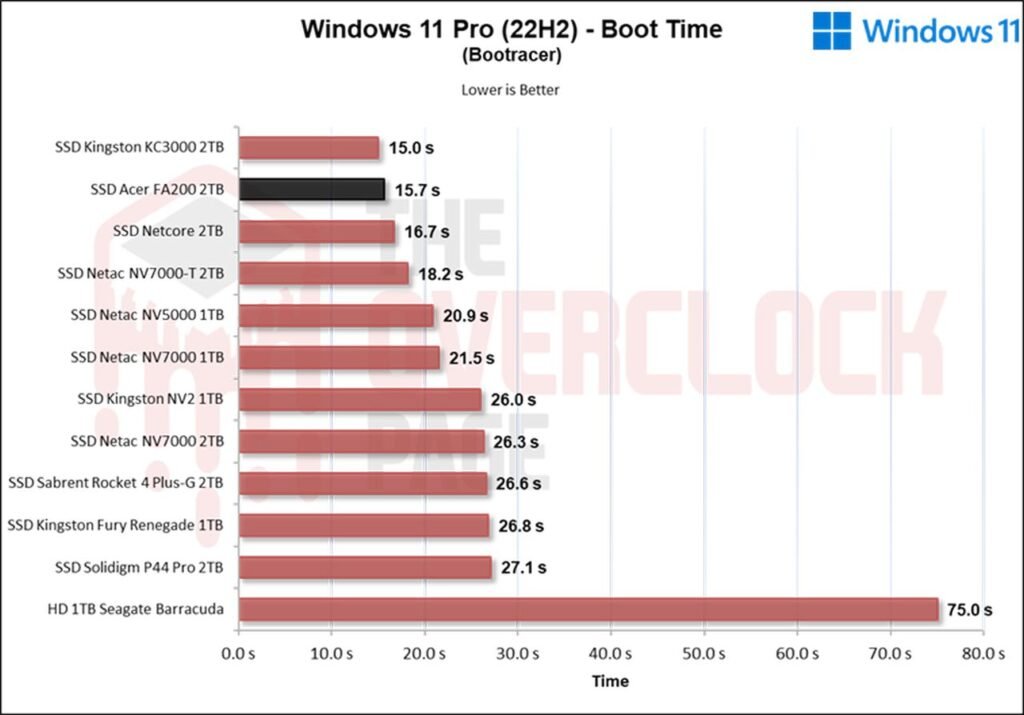
In this program, it includes the time from boot until the loading of the last OS drivers. In this case, a clean installation is performed with only operating system drivers such as Network, Wireless + Bluetooth, Audio, Nvidia drivers, PCH, among others. Therefore, we are pleased to see that it had one of the shortest loading times so far, coming in at 15 seconds.
SUSTAINED WRITE SPEEDS | SLC CACHING
A large portion of SSDs currently on the market utilize SLC caching technology, where a certain percentage of their storage capacity, whether it’s MLC (2 bits per cell), TLC (3 bits per cell), or QLC (4 bits per cell), is used to store only 1 bit per cell. In this case, it’s used as a buffer for writing and reading, where the controller begins writing, and when the buffer is depleted, it writes to the native NAND Flash (MLC/TLC/QLC).
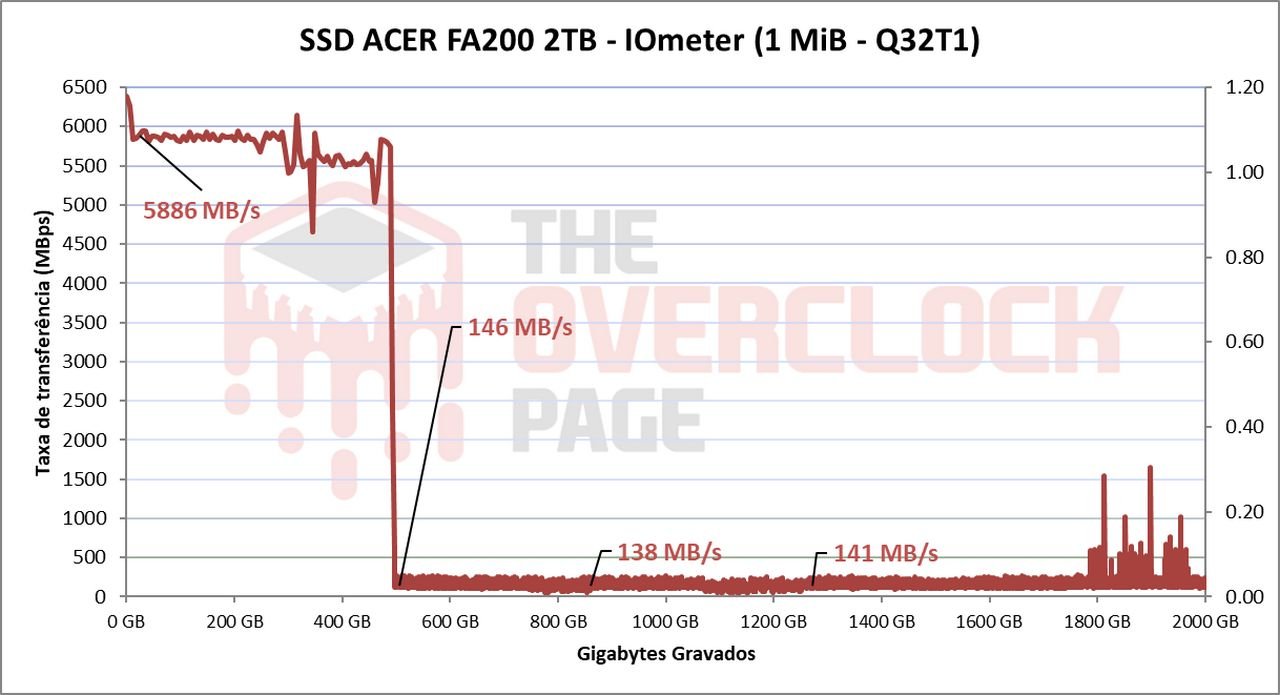
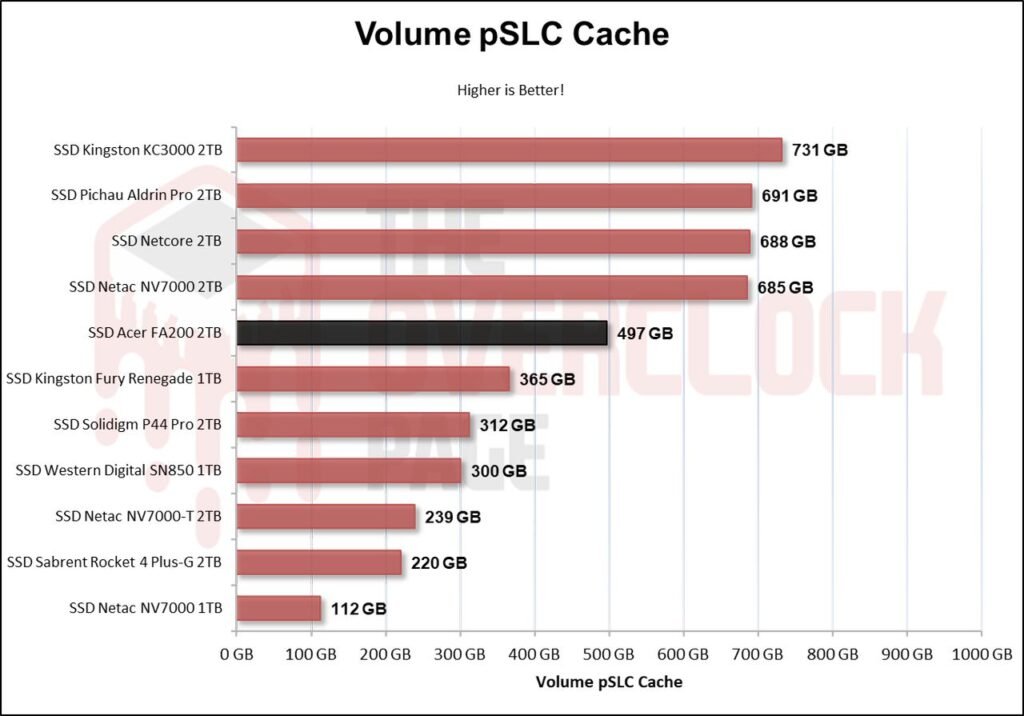
Through IOmeter, we can get an idea of the SLC cache volume of this SSD, as manufacturers often do not provide this information. From the tests we conducted, it was observed that it has a seemingly dynamic, immense pSLC cache volume of around 497GB. It managed to maintain an average speed of approximately 5746MB/s until the end of the buffer, which is a good speed considering this is a PCIe 4.0 2TB SSD with 16 QLC dies.
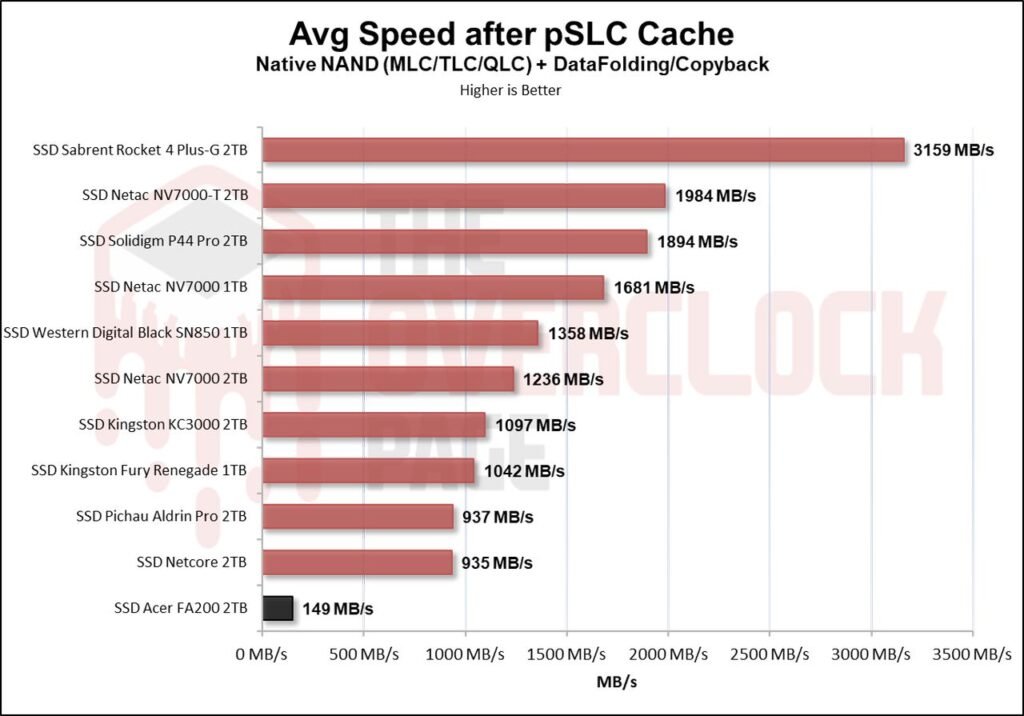
After having written 497GB, it begins the folding process, as it has allocated its entire capacity to work as pSLC. Now we see the true “Achilles’ heel” of QLC SSDs. Its sustained speed was quite low, around 149 MB/s on average.
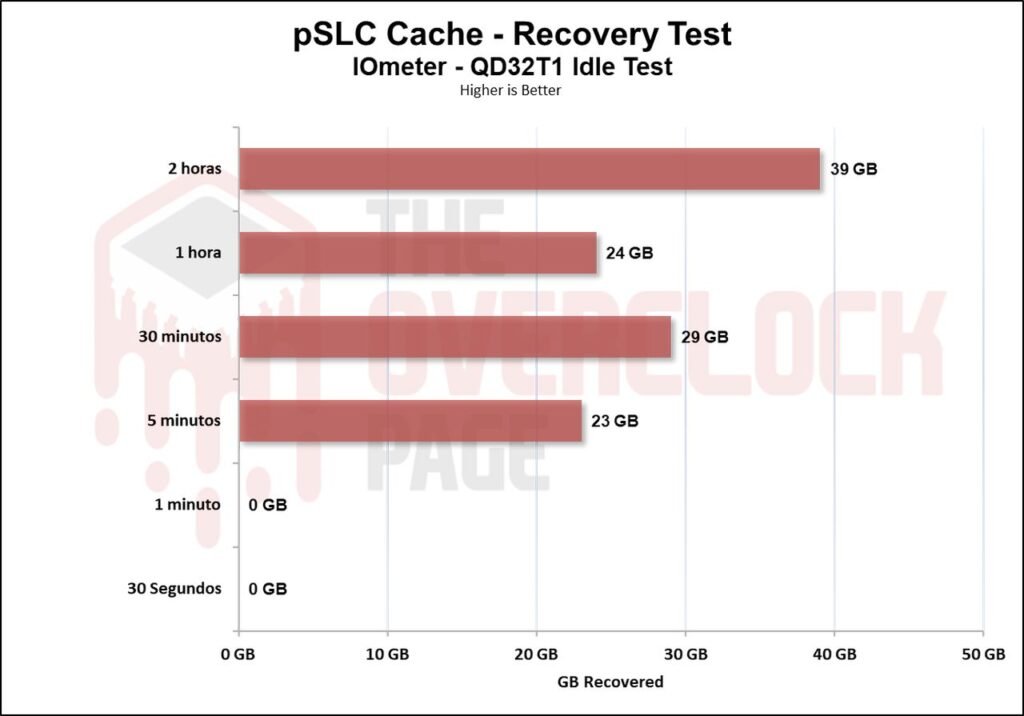
We also conducted a test to see how long the SSD would take to recover part of its buffer. Throughout our test battery, which lasts from 30 seconds to 2 hours in idle, we used TRIM and garbage collection compared to not using TRIM/GC. When testing without using TRIM/GC, we observed that it can recover approximately 23GB to 39GB between 5 minutes and 2 hours in idle, which was a satisfactory result considering such a completely unrealistic scenario.
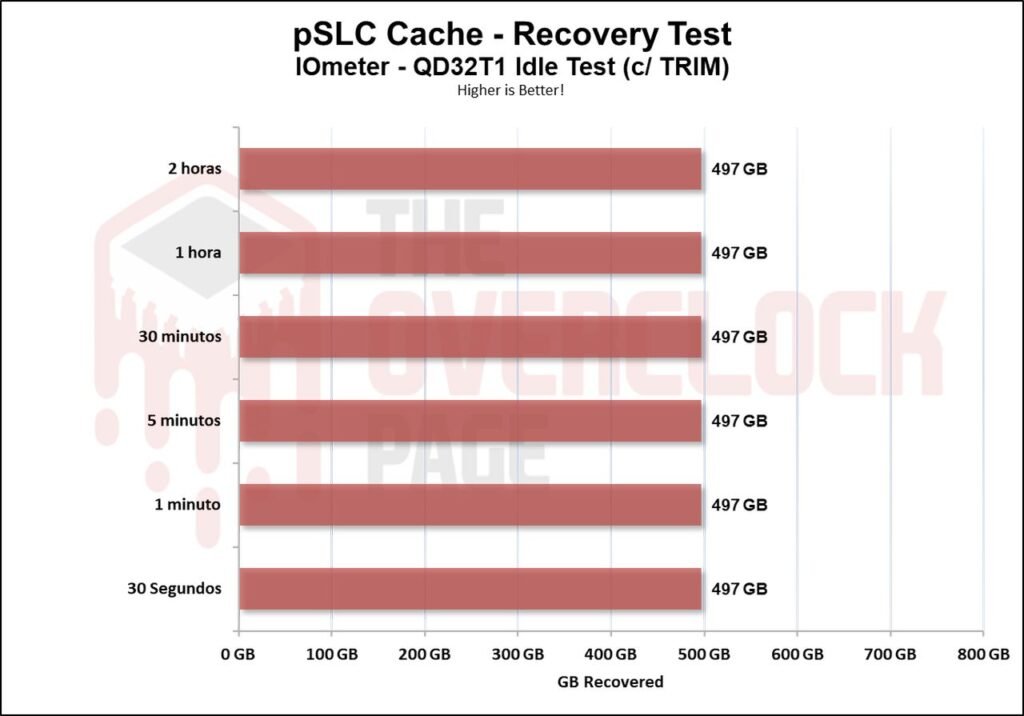
But when testing with TRIM/GC activated, it is able to recover its full volume in just a few seconds.
FILE COPY TESTING
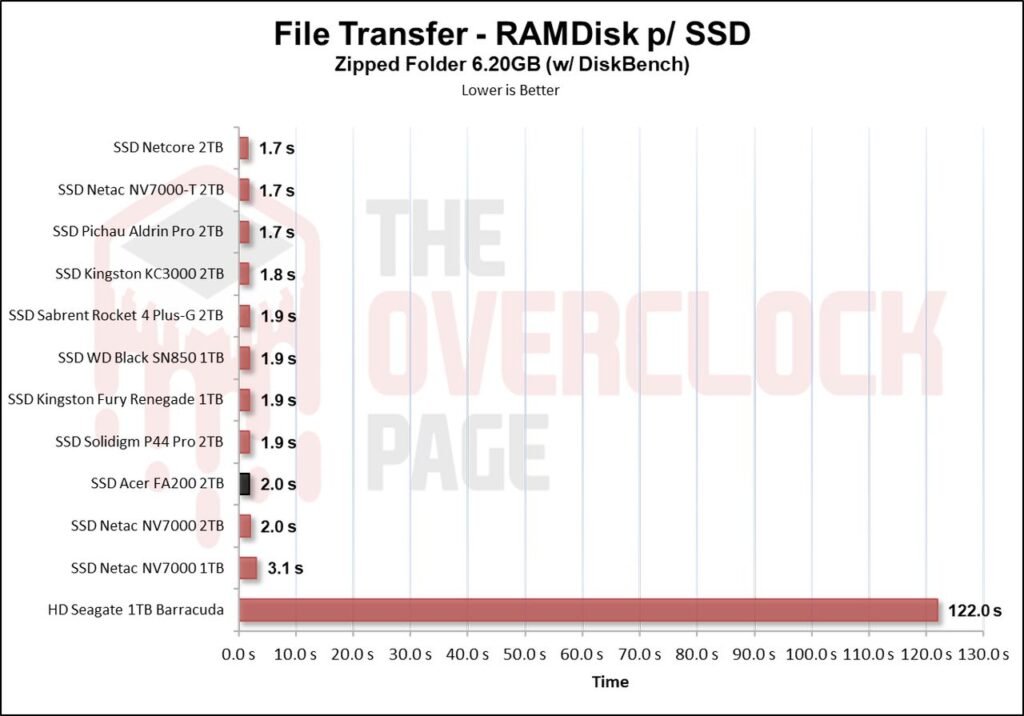
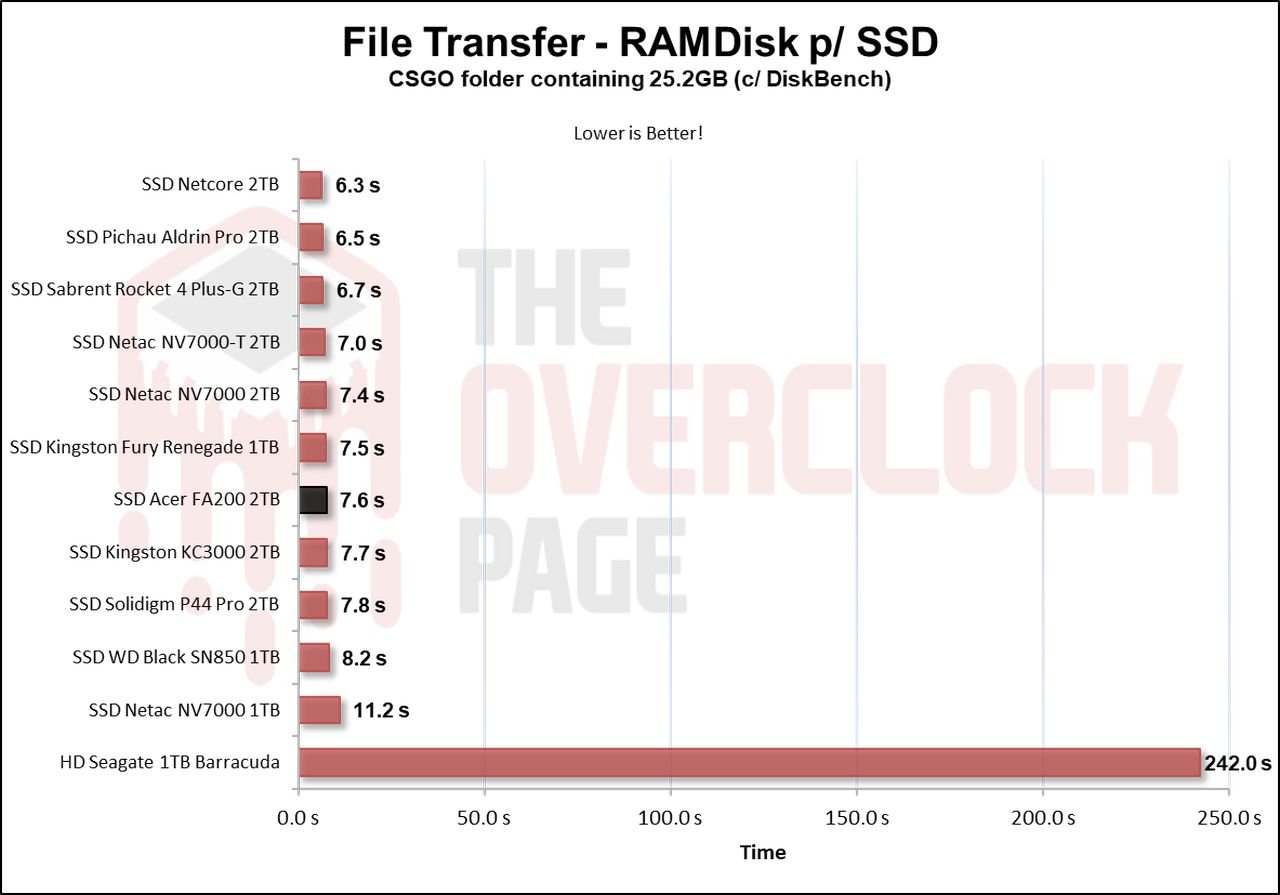
In this test, the Windows 10 21H1 ISO of 6.25GB (1 file) was copied along with the Counter-Strike: Global Offensive (CSGO) installation folder of 25.2GB from a RAM Disk to the SSD to see how it performs.
When using the Windows 10 .ISO image, we see that it performed similarly to the NV7000 (IG5236 + CDT1B) 2TB SSD.
When performing the same test with a much larger folder, such as a game, we see a similar result. This happens due to its immense volume of SLC cache, which levels the performance of these Gen4 SSDs significantly.
TEMPERATURE TEST
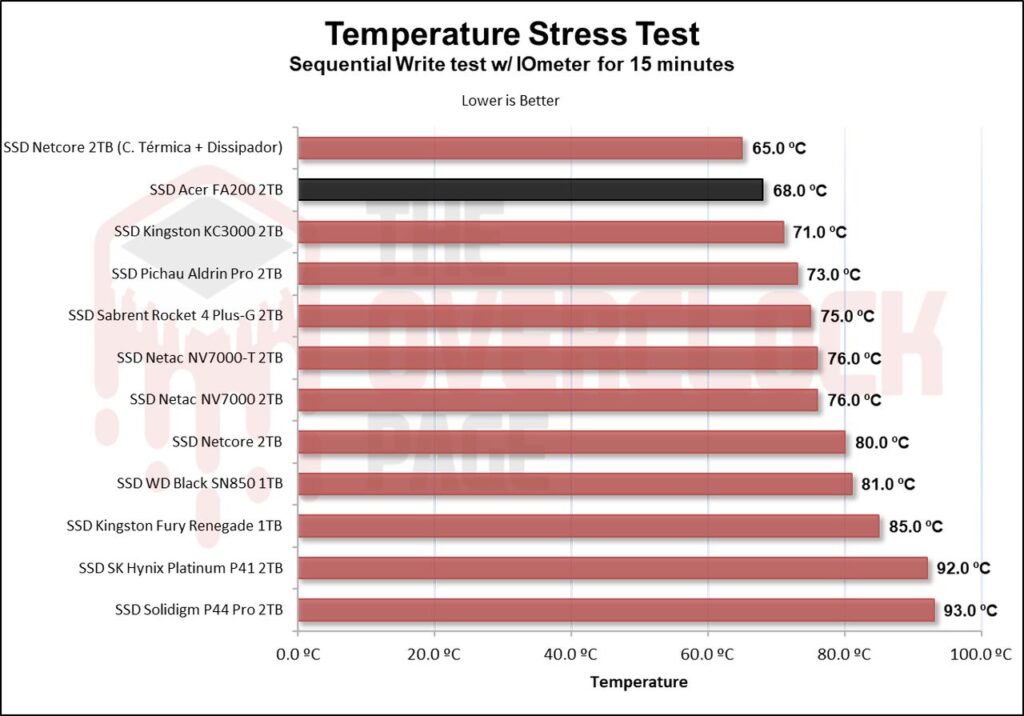
In this section of the analysis, we will observe the temperature of the SSD during a stress test, where the SSD continuously receives files. This allows us to determine if there was any thermal throttling with its internal components that could cause bottlenecking or loss of performance.
As seen above, this SSD by default has a thermal throttling limit of 90°C to 95°C, which is a somewhat high value. However, the SSD didn’t even come close to reaching that temperature because its SLC cache volume depletes very quickly, so it doesn’t have much time to heat up. Additionally, since it is an SSD with low sustained write speed, it contributes to keeping the temperature from rising significantly.
POWER CONSUMPTION AND EFFICIENCY
SSDs, like many other components in our system, have a certain electrical consumption. The most efficient ones can perform tasks quickly and with relatively low power consumption, allowing them to transition back to idle power states where they tend to consume less.
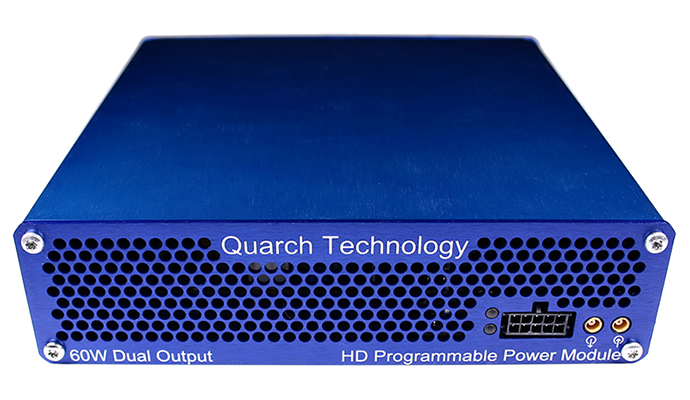
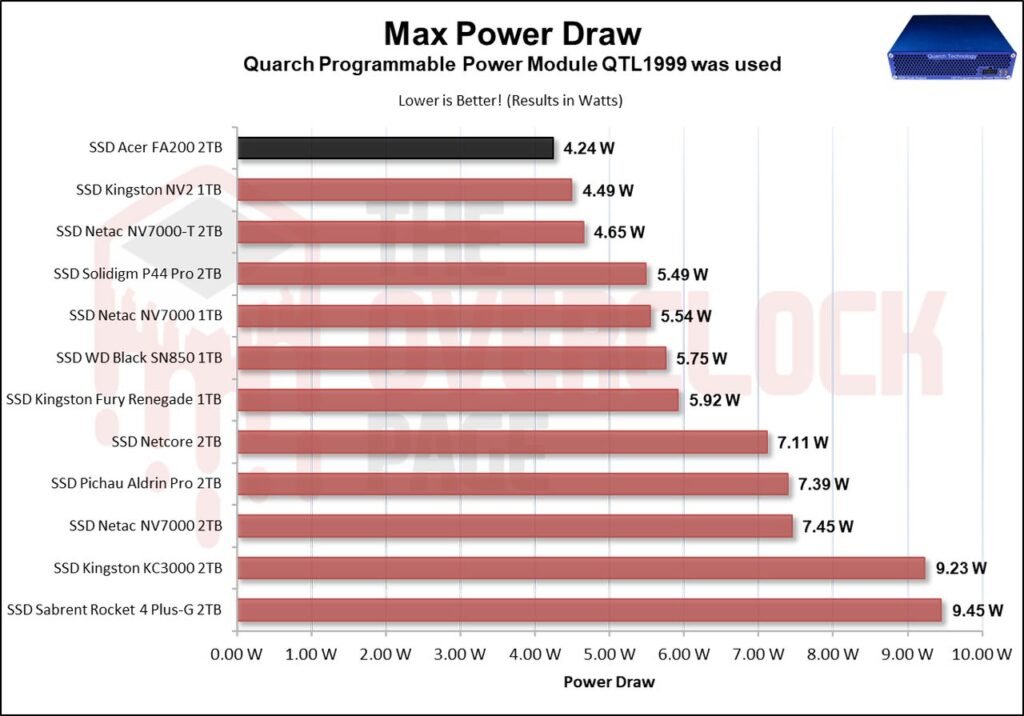
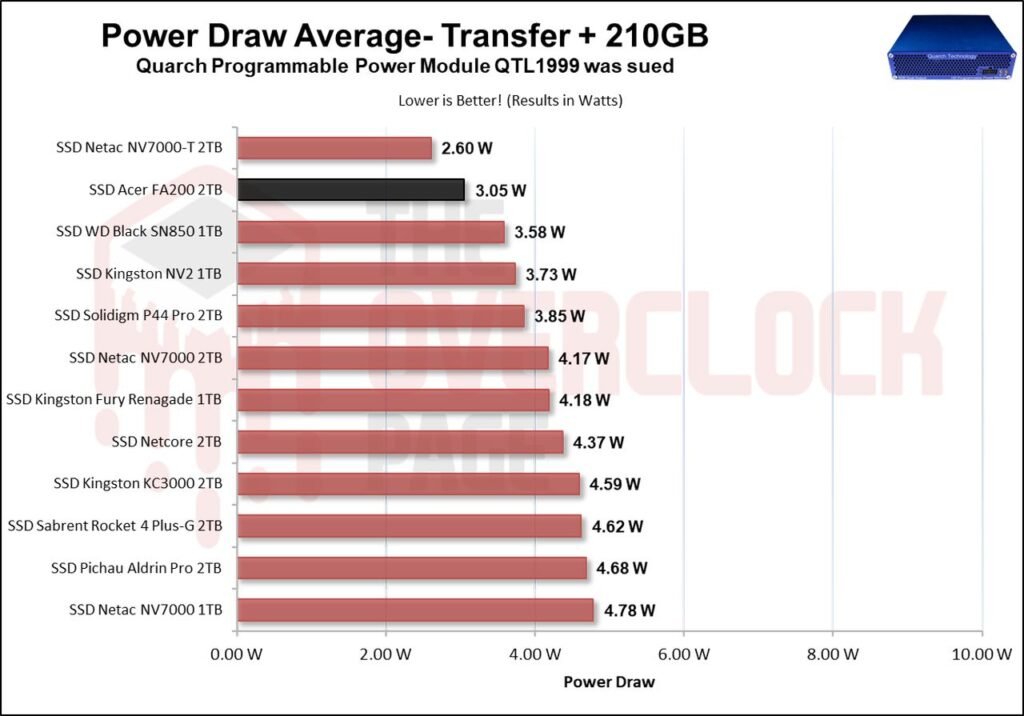
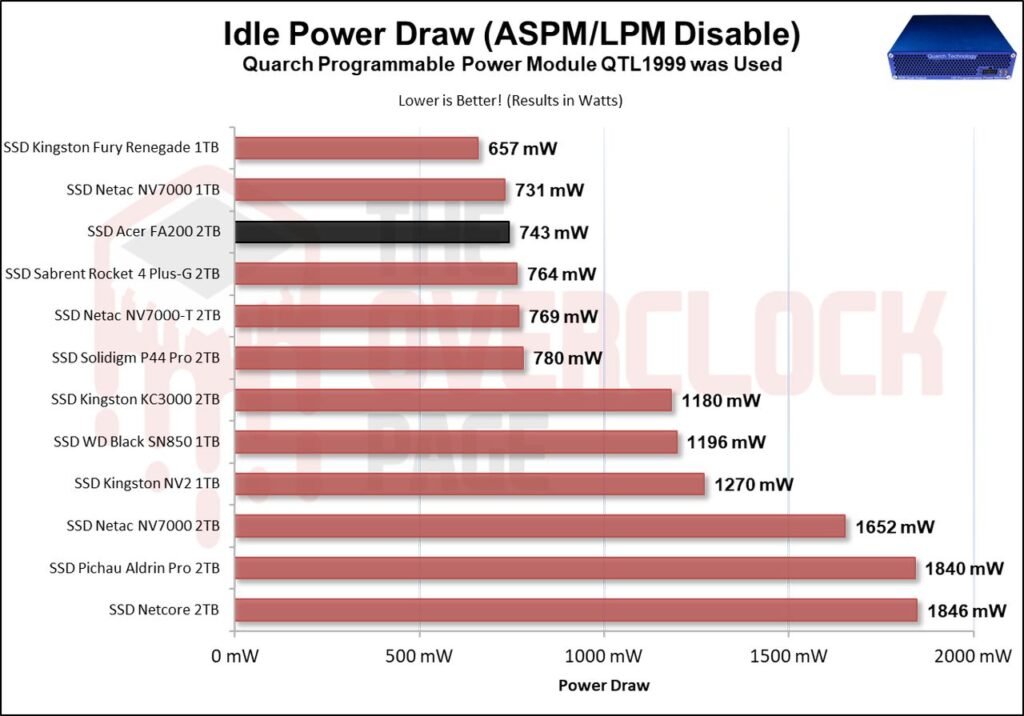
In this section of the analysis, we will utilize the Quarch Programmable Power Module sent to us by Quarch Solutions (pictured above) to conduct tests and assess the efficiency of the SSD. Three tests will be performed: the maximum power consumption of the SSD, an average in practical and casual scenarios, and during idle.
This set of tests, especially efficiency and idle power consumption, is important primarily for users intending to use drives in laptops. SSDs spend the vast majority of their time in low-power states (idle), so this helps significantly in saving battery life.
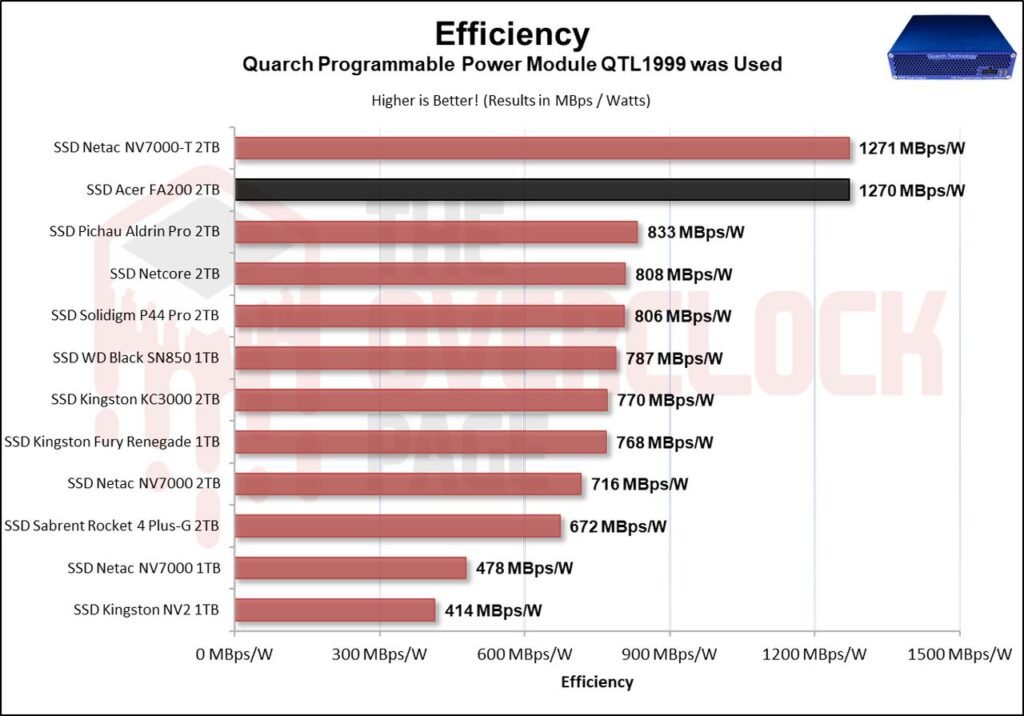
The SSD demonstrated a high level of efficiency, as out of the 220GB transfer, it was completed within the SLC cache region, and we will see that its average was quite high in the SLC cache region.
Regarding its maximum power consumption, we see an incredible feat: it had the lowest consumption in the comparison, of less than 4.3W.
And here, in its average power consumption, we see why it had such great efficiency. We can observe that it had very low electrical consumption, just slightly higher than the NV7000-T.
Lastly, and most importantly, the idle test, representing the scenario where the vast majority of SSDs are in everyday use. Here, we see that it once again surprises with a very low power consumption compared to other Gen4 SSDs.
CONCLUSION
Taking all of this into account, is it really worth investing in this SSD?
Although it’s not available yet, it’s definitely worthy it if you can get it from abroad. However, given that it’s not available, there are indeed several other SSDs here in US and China with the same Maxiotech controller but with TLC NANDs, offering similar or even superior performance at an attractive price.
ADVANTAGES
- Exceptional sequential speeds, especially as it reaches 6000 MB/s or more.
- Great random speeds.
- Good latency results.
- Excellent practical performance for casual scenarios and even professional environments like video editing, particularly within the SLC cache region.
- No variants with different components.
- No thermal throttling.
- Excellent internal construction, with high-quality controller and NAND flash despite being QLC.
- Big pSLC cache.
- Reasonable recovery rate of pSLC cache.
- Comes with basic cloning software (Acronis).
- High energy efficiency.
- Low idle power consumption.
- Aggressive pricing (International market).
DRAWBACKS
- Very low sustained write speed due to being QLC.
- Does not come with management software.
- Durability is good for QLCs but lower than other TLCs.
- Not available in Brazil.
- Lacks encryption.








Is it NVMe2.0 or 1.4? It mentions 2.0 in article, but 1.4 in the spec table