Review – SSD Kingston Fury Renegade 1TB – Great performance for a reasonable price!
Today, we will be testing a Kingston NVMe SSD from the high-end segment: the Fury Renegade model. Kingston kindly sent us this unit for testing purposes – thank you, Kingston ?.
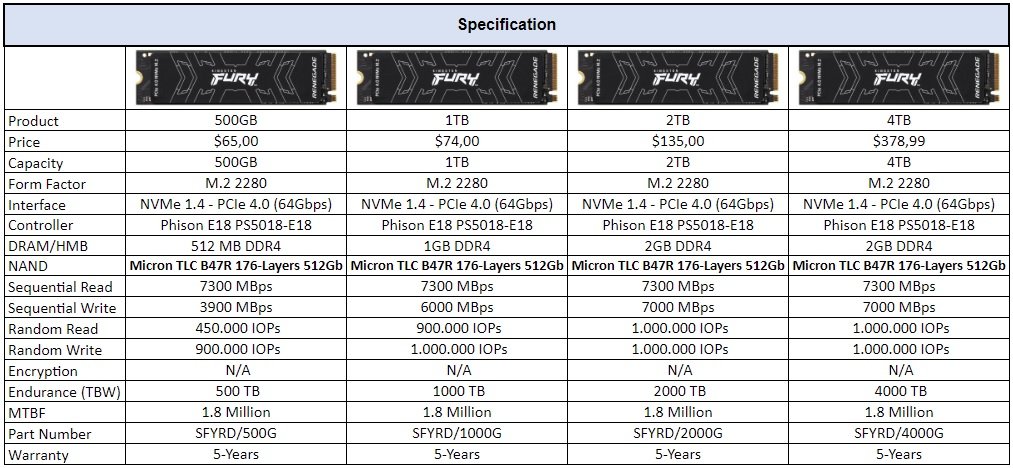
The SSD comes in the M.2 form factor with a 64Gbps bus, which translates to 4 PCIe 4.0 lanes, NVMe 1.4 protocol, and capacities ranging from 500GB to 4TB. The price usually hovers around $74 for the 1TB unit, while the 2TB option is slightly more expensive at around $134.99. The 4TB version is priced at $378.99.
This product lineup has recently received an update with a new line of SSDs that includes a heatsink.
SSD Specification
Next, here are some more detailed pieces of information about the SSD that will be tested (1TB unit):
SSD Software Bundle
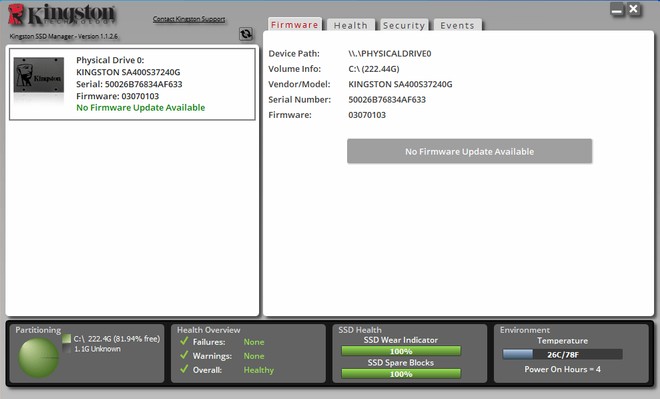
Kingston also provides a program known as “Kingston SSD Manager”, available for download on its website. This software offers a range of options for managing and controlling their products, as we will explore in the following sections.
Among these functions, we can see the ability to update the SSD’s firmware, check the SSD’s health, and allow SMART reading.
Unboxing
The SSD is packaged in a simple paper box that displays essential information on the front, such as the model and capacity. The box features a transparent plastic window through which the SSD is visible.
This model uses a single-sided design, with integrated circuits (ICs) only on the front side of the PCB. This design aids in the cooling of the SSD, without any type of heat spreader. As we’ll see throughout the analysis, this wasn’t even necessary.


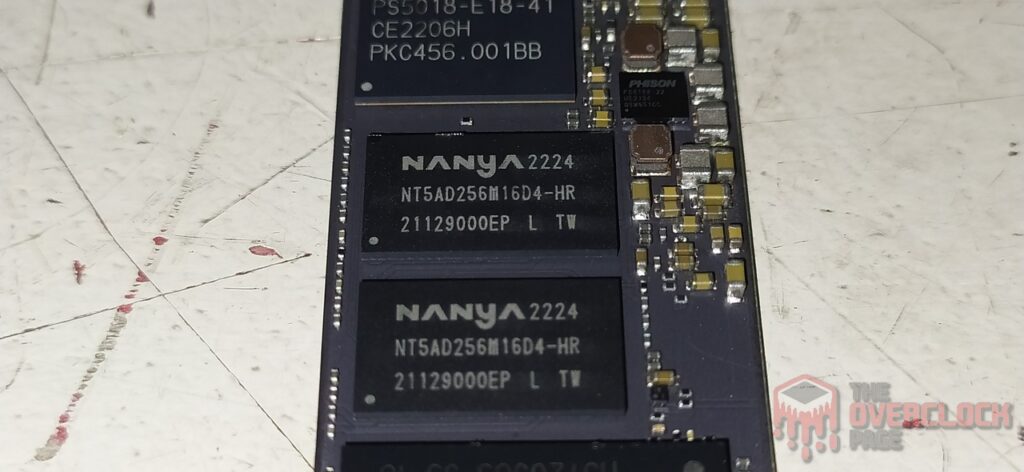
By default, it arrives with 9.9% of its volume allocated for over-provisioning. On the front side of its PCB, we find six primary chips, including two NAND Flash chips, a controller, and its PMIC, in addition to two DRAM Cache chips.


Controller
The SSD’s controller is responsible for handling all data management, over-provisioning, and garbage collection tasks, among other background functions. And, of course, this contributes to the SSD’s excellent performance.
This SSD utilizes a high-end Phison controller, the PS5018-E18-41, which is an ARM 32-bit ISA model with “5” Cortex® R5 cores (Penta-core), manufactured using TSMC’s 12nm process. It operates at a clock speed of 1 GHz on its main cores. In this case, this controller is common in other top-of-the-line SSD projects like the Corsair MP600 HydroX, MP600 Pro, Galax Hall of Fame Extreme, the new Aorus Xtreme, and other models such as the Sabrent Rocket 4 Plus that we tested in the past.
In this case, it’s a triple-core controller, meaning it has 3 main cores responsible for NAND management, with support for a technology called “CoXprocessors” – which is essentially another Dual-Core Cortex® R5 core with a much lower frequency (usually around 200~300 MHz). This is designed to handle simpler and more predictable tasks, thereby reducing the load on the 3 main cores, as well as the electrical consumption and heat dissipation that can lead to thermal throttling, considering that this SSD can consume nearly 9W. One of these functions, for example, is to take care of repetitive sections of code and firmware functions that the main cores wouldn’t need to handle. Additionally, it manages data storage in the DRAM Cache, while the main cores are allocated to tasks like Write/Read/Host operations.
This controller also features support for up to eight communication channels with a bus speed of up to 1600 MT/s. Each of these channels supports up to four “Chip Enable” commands, enabling the controller to communicate with up to 32 Dies simultaneously using the interleaving technique.
DRAM Cache or H.M.B.
Every high-end SSD that aims to provide consistent high performance requires a buffer to store its mapping tables (Flash Translation Layer or Look-up table). This allows it to achieve better random performance and responsiveness.
We can observe that this SSD is equipped with two DRAM Cache chips from the manufacturer Nanya, model NT5AD256M16D4-HR. These are DDR4 ICs with a density of 4Gb, equivalent to 512MB. They can operate at speeds of up to 2666 MT/s, with CL-19 latencies and a voltage of 1.2V.
NAND Flash
Regarding its integrated storage circuits, the 1TB SSD features 2 NAND flash chips labeled as “FP51208UCM1–B1,” which have been rebranded by Kingston. These are NANDs from the american manufacturer Micron, with the model B47R. In this case, they are 512Gb dies (64GiB) containing 176 layers of data and a total of 195 gates, resulting in an array efficiency of 90.2%.
In this SSD, each NAND Flash chip consists of 16 dies with a density of 512Gb, resulting in a total of 512GB per NAND chip. When combined, these NAND chips generate a total of 1TB capacity. They communicate with the controller through a maximum bus speed of 1600 MT/s for optimal performance.
These dies feature a new topology from Micron known as Replacement Gate (R.G.), which essentially combines the Charge Trap architecture with the CuA (CMOS-under-Array) technology. This combination ensures that the Peripheral Circuitry doesn’t occupy unnecessary space on the die. As a result, it allows for die sizes up to 30% smaller.
Another innovation they’ve introduced is a significant reduction in complexity in the programming processes and even overhead. This has been achieved through the replacement of the Silicon Gates, which traditionally used Polysilicon, with the exclusive use of metal. Alongside this, they’ve adopted a different etching technique, involving the drilling they use for circuitry and strings, effectively reducing resistance.
PMIC (Power Delivery)
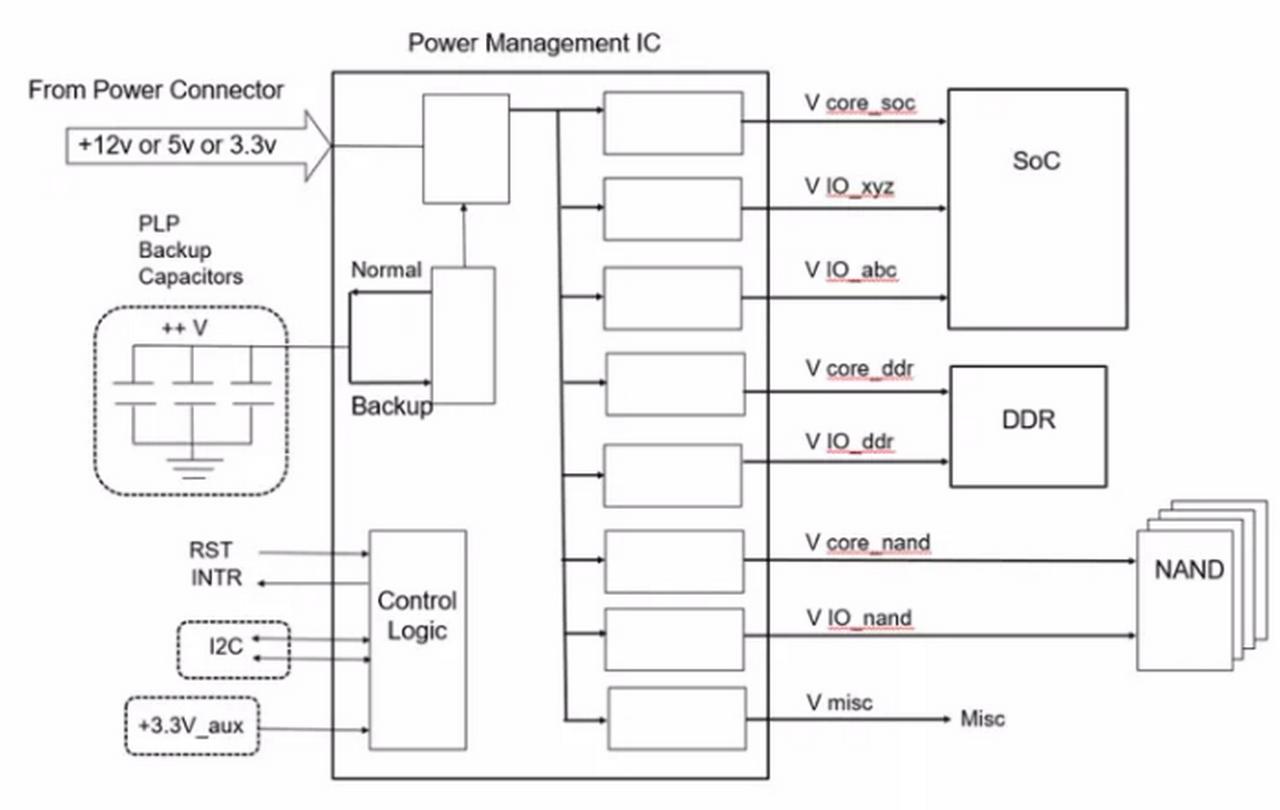
Just like any electronic component that uses eletricity, SSDs also have a power consumption level that can range from a few milliwatts to nearly 10 W, nearing the limit of some connectors or slots. The circuit responsible for all power management is the PMIC, which stands for “Power Management IC.”


In this SSD, it employs the well-known PMIC that Phison has been using for a long time, the PS6108-22.
SSD Power States
As we always mention in power consumption analyses, in this section, we will delve further into the power states of this SSD.
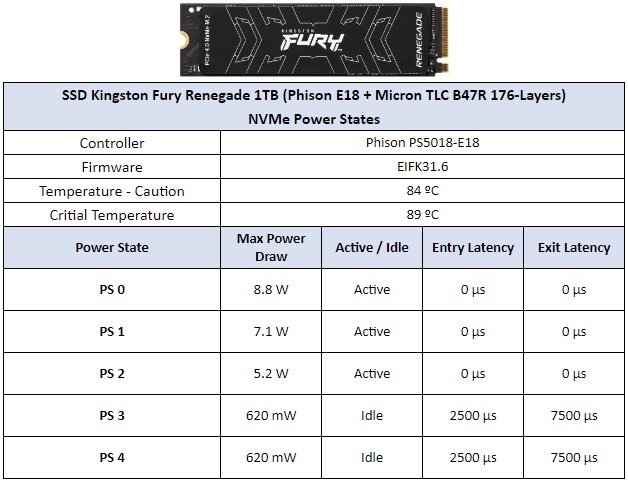
Regarding its primary power states, among the five main states, three are active states with a specified consumption of “8.8W.” However, we will assess its actual performance as it could vary significantly from this specified value.
It’s also noteworthy that the manufacturer sets a relatively high cautionary and thermal throttling temperature for the controller. This decision carries both positive and negative implications. On the positive side, it ensures that the SSD won’t experience throttling. However, operating at high temperatures for extended durations could potentially impact the product’s lifespan. As we progress through the analysis, we will observe how the SSD fares under these conditions.
CURIOSITIES ABOUT THE KINGSTON FURY RENEGADE
Similar to how integrated circuits within a RAM module can exhibit variation, the same principle applies to SSDs, where changes in components like the controller and NAND flash chips can occur.
First and foremost, a significant resemblance to the Kingston KC3000 SSD is apparent. This similarity arises from the fact that both share the same design, albeit with minor differences. One of the primary distinctions is that the KC3000 features a slightly smaller factory-configured over-provisioning volume when compared to the Fury Renegade. As a result, the KC3000 exhibits a slightly lower endurance, with 800 TB of TBW (Total Bytes Written) in contrast to the Fury Renegade’s 1,000 TB of TBW, for their respective 1TB versions.
Fortunately, no new variants of this SSD have emerged as of the time of this analysis.
TEST BENCH
– Operating System: Windows 10 Pro 64-bit (Build: 21H2) + Windows 11 Pro 64-bit (Build: 21H2)
– CPU: AMD Ryzen 9 5950X (16C/32T) (All Core, 4 GHz)
– RAM: 2 × 16 GB DDR4-3200MHz CL-16 Netac (w/ XMP)
– Motherboard: Gigabyte X570s Aorus Elite AX (Bios Ver.: F5c)
– GPU: RTX 3050 Gigabyte Gaming OC (Drivers: 512.xx)
– Boot Drive (OS): SSD SK Hynix Platinum P41 2TB (Firmware: 51060A20)
– SSD DUT: SSD Kingston Fury Renegade 1TB (Firmware: EIFK31.6)
– Chipset AMD X570: 4.03.03.431.
– Windows: Indexing disabled to avoid affecting test results.
– Windows: Windows updates are disabled to avoid affecting the test results.
– Windows: Most of the background running Windows applications were disabled.
– Boot Time Windows: Clean OS Install
– pSLC Cache Test: Drive is active cooled in order to avoid thermal throttling
– Windows: AV disabled to avoid affecting the test results.
– SSDs were tested as a secondary drive, with 0% of space being utilized, and other tests with 50% of space being utilized to represent a realistic scenario.
– Quarch PPM QTL1999 – Power consumption test: it is performed with 3 parameters, first in idle where the disk is left as a secondary drive and after a period of idle time, a 1-hour write test is conducted, and the average is taken.
WHERE TO BUY
Next, I will be listing some affiliate links on Amazon for those interested in contributing to the website in some way.
Amazon – SSD Kingston Fury Renegade 500GB
Amazon – SSD Kingston Fury Renegade 1TB – U$73
Amazon – SSD Kingston Fury Renegade 2TB
Amazon – SSD Kingston Fury Renegade 4TB
CRYSTALDISKMARK
We conducted synthetic sequential and random tests with the following configurations:
Sequential: 2x 1 GiB (Blocks 1 MiB) 8 Queues 1 Thread
Random: 2x 1 GiB (Blocks 4 KiB) 1 Queue 1/2/4/8/16 Threads
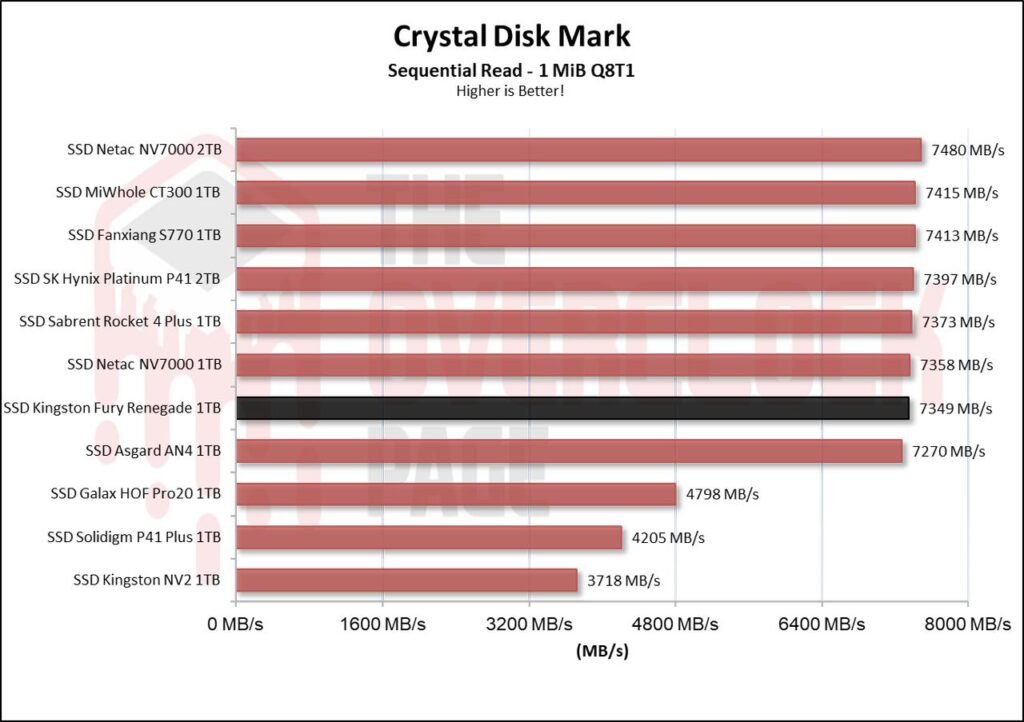
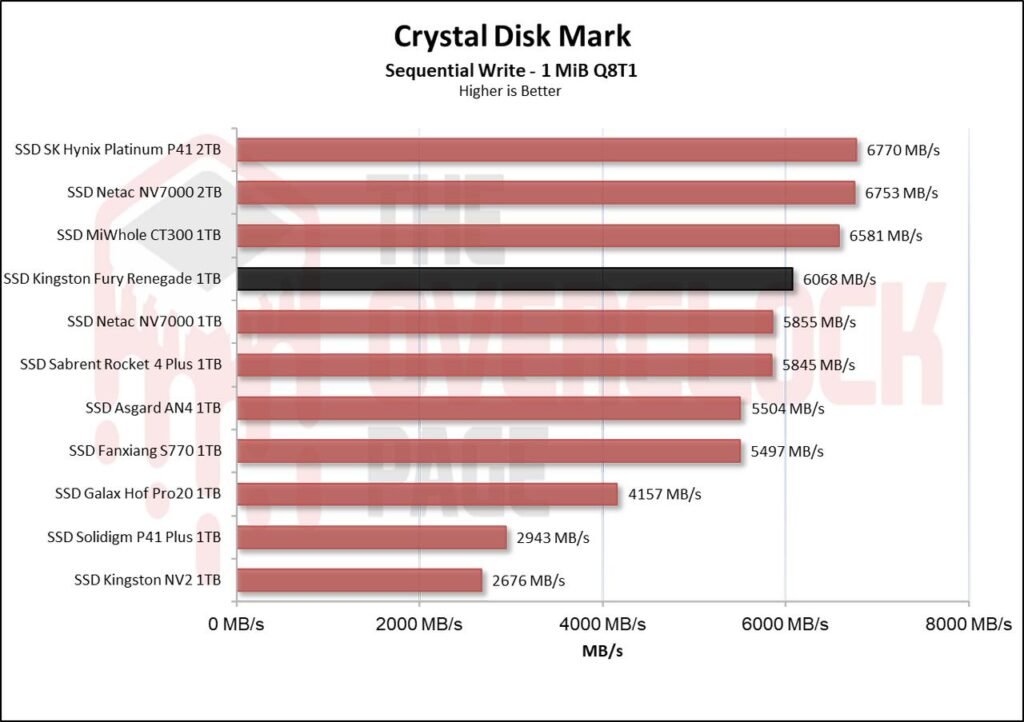
When testing its sequential speeds, this Kingston unit performed in line with the manufacturer’s specifications. We can observe that its write speed manages to stay above 6GB/s, which is more challenging to achieve with 1TB units.
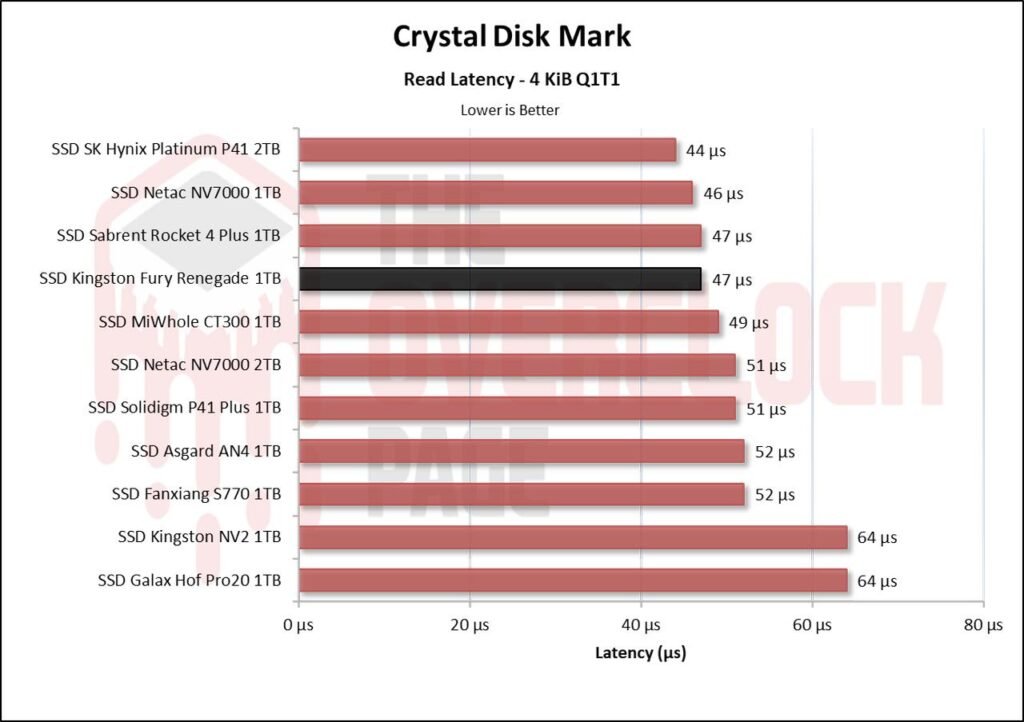
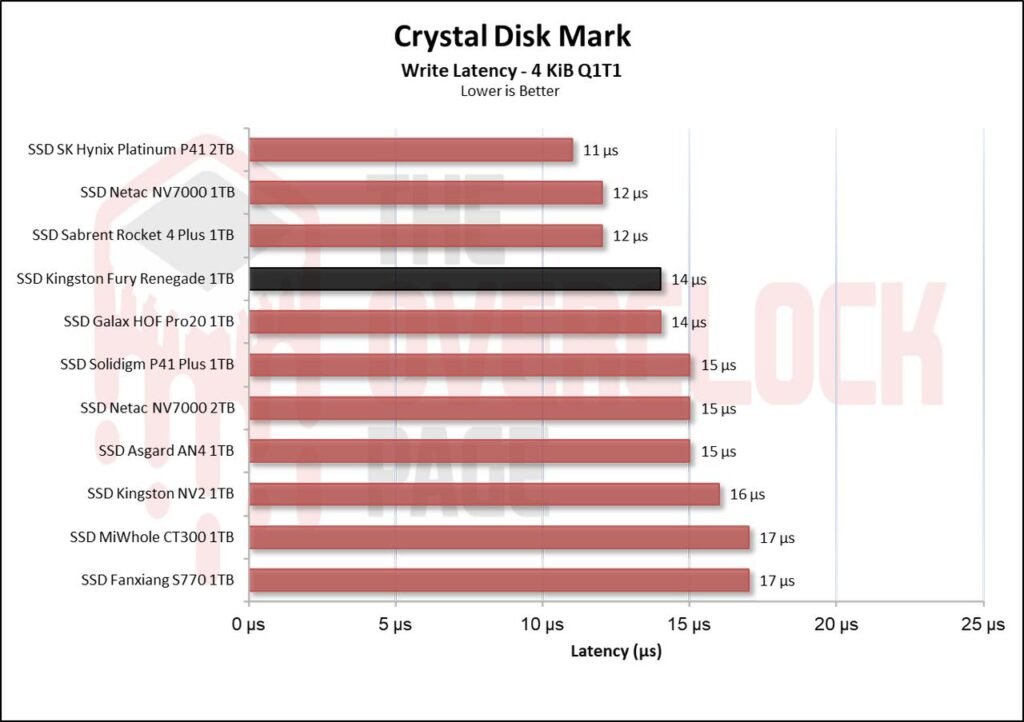
As for its latencies, we can see that it achieved excellent results, especially in terms of its write latency. This can be attributed to the strong combination of the controller and NANDs used in this SSD.
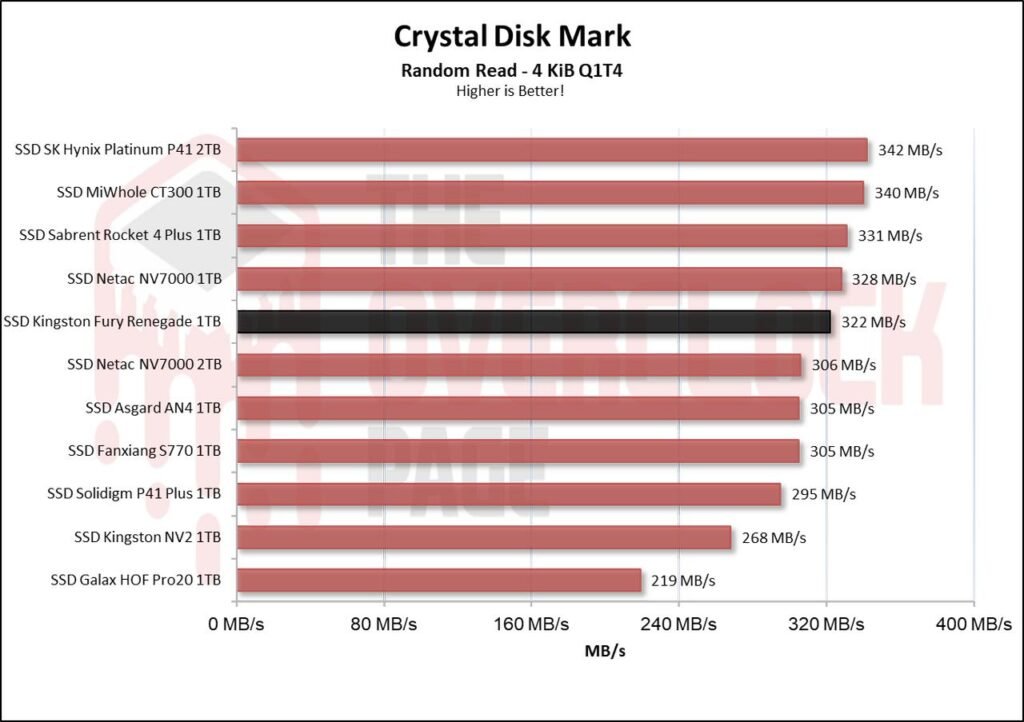
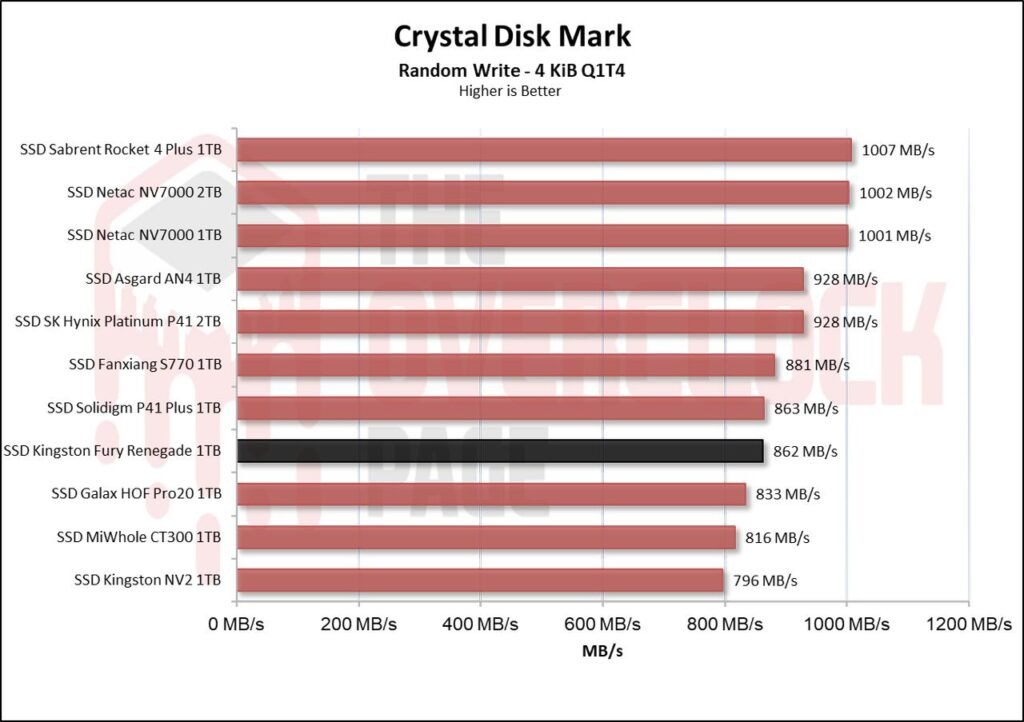
When testing its random speeds at a ‘Queue depth’ of 4, we observed that in terms of read performance, there’s a technical tie between this 1TB NV7000 and another model we tested, the NV7000 2TB. Both have the same internal construction. In terms of write performance, the results are similar to those of the Solidigm P41 Plus, which was a less surprising outcome.
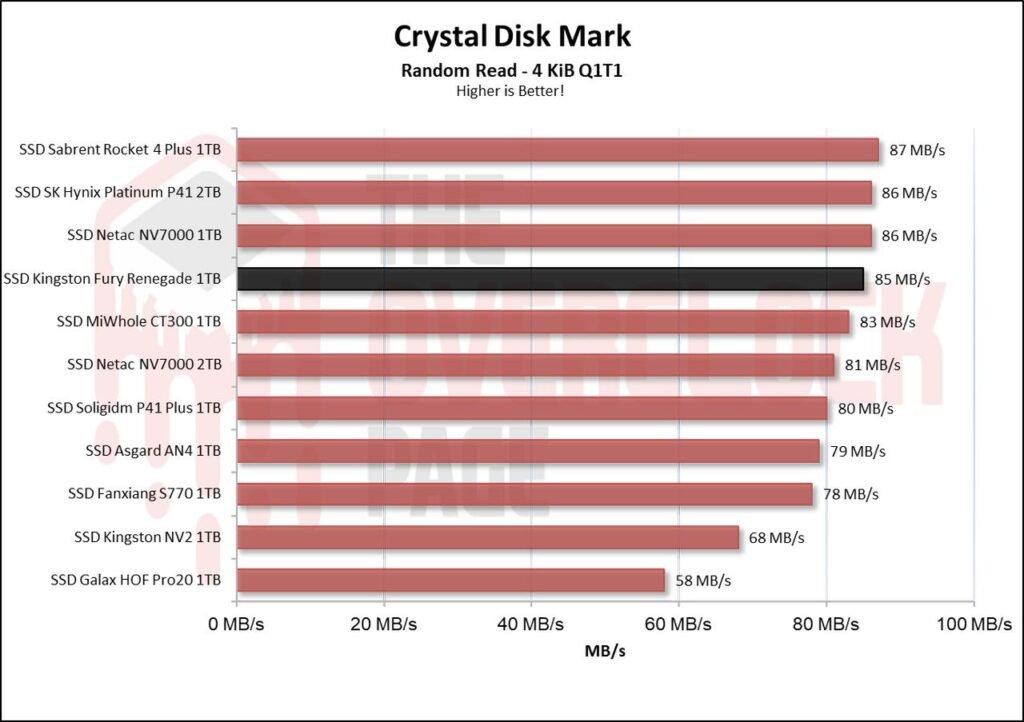
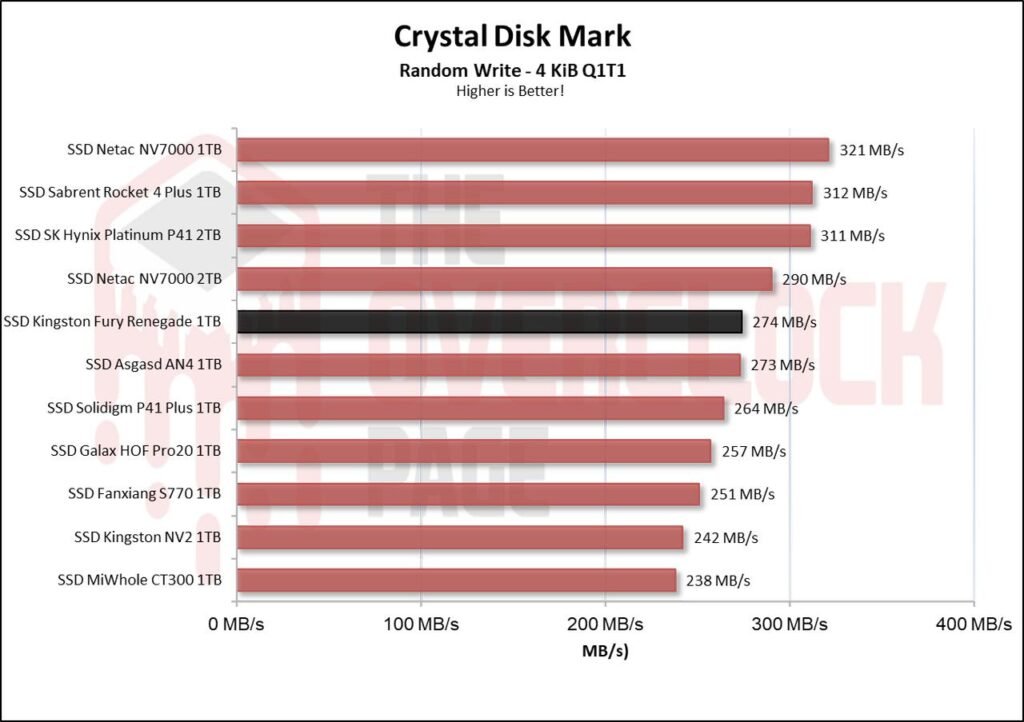
When allocating only 1 thread to better represent a typical daily workload, we observed the same behavior. In terms of read performance, the SSD achieved an excellent result. However, in terms of write performance, it falls slightly behind units with a greater number of dies, such as the Platinum P41 or NV7000.
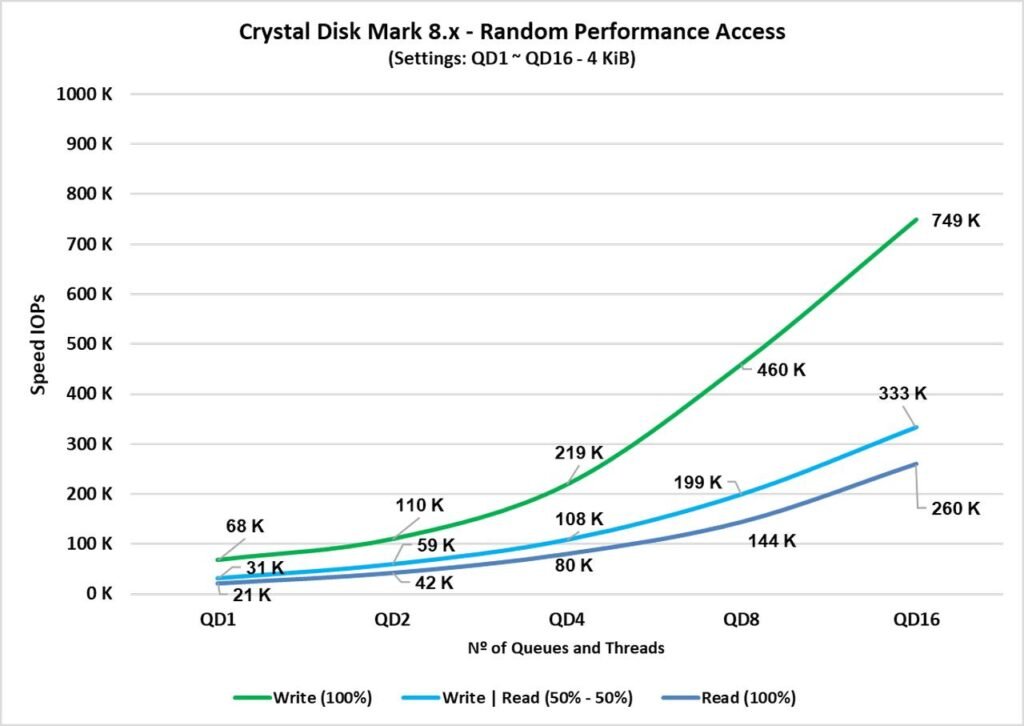
In this test, three access configurations were performed across various queue depth settings, ranging from QD1, representing everyday usage, to QD16, which becomes quite demanding and more comparable to virtualized environments.
We found that in these synthetic tests we conducted, the SSD delivered excellent results. Once again, these speeds aren’t exactly what the manufacturer advertises, as they reflect “more realistic” scenarios compared to the manufacturer’s claims.
ATTO Disk Benchmark QD1 e QD4
We conducted a test using ATTO to observe the SSD speeds at various block sizes. This benchmark was configured as follows:
- Blocks: Ranging from 512 Bytes to 8 MiB
- File size: 256MB
- Queue Depth: 1 and 4.
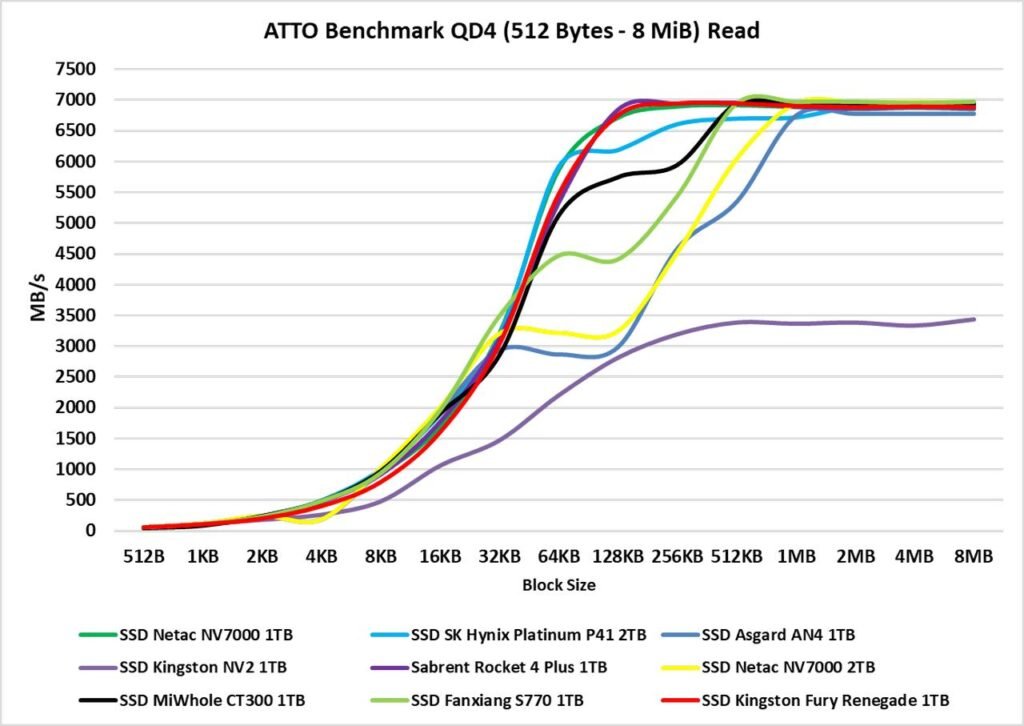
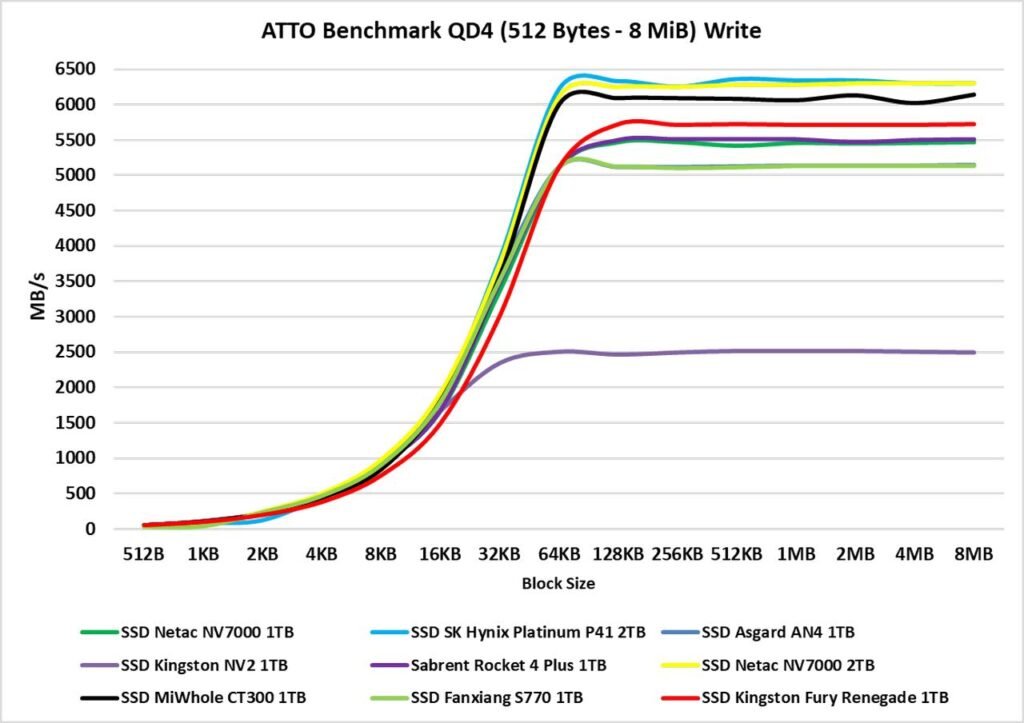
The ATTO Disk Benchmark is software that performs a sequential speed test with compressed files. This simulation mirrors data transfer loads similar to those seen in Windows. Typically, data blocks range from 128KB to 1 MiB. However, as the block size decreases, the performance remains similar to other SSDs. As the block sizes increase, the actual differences become more apparent, particularly in terms of read performance.
In the case of write tests, although the SSD showed good results for certain block sizes, such as 8KB to 64KB, it falls behind other SSDs in the comparison. However, its write performance returns to its previous level afterward.
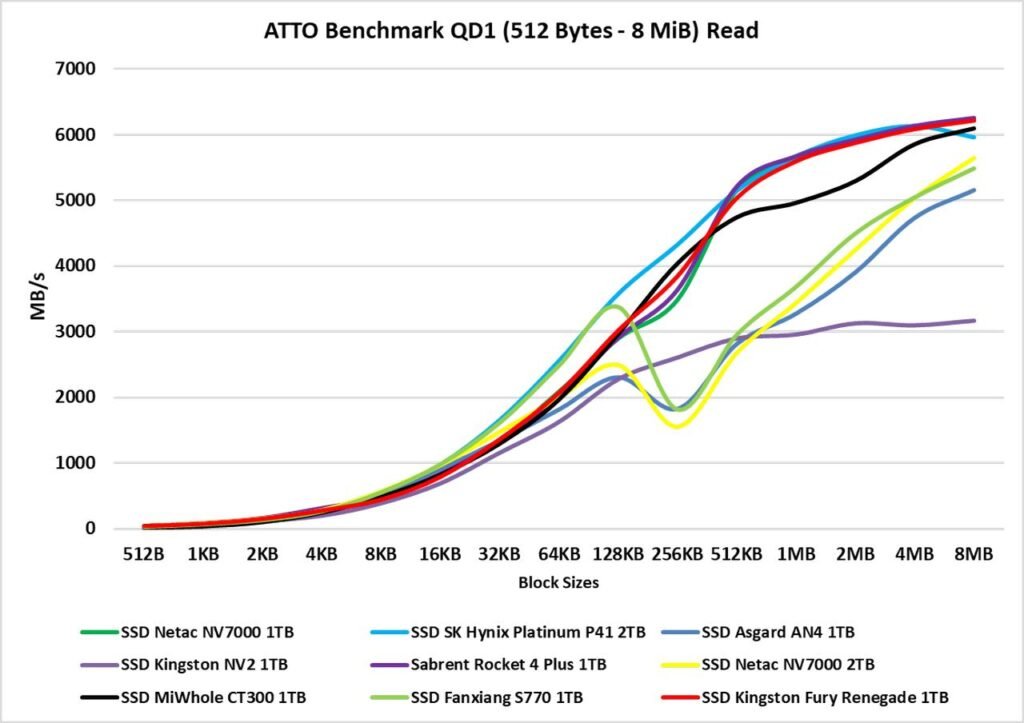
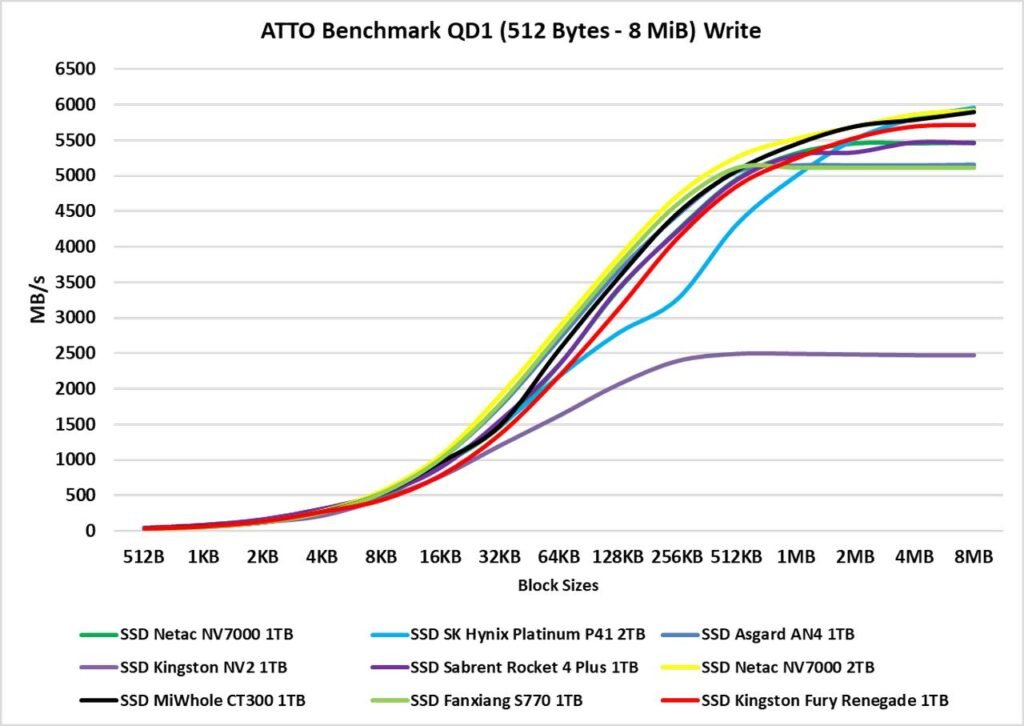
When using QD1, we noticed that the same pattern repeated itself. However, one positive aspect is that it didn’t experience a sudden drop in read performance like we’ve seen with various SSDs using Innogrit controllers.
3DMark – Storage Benchmark
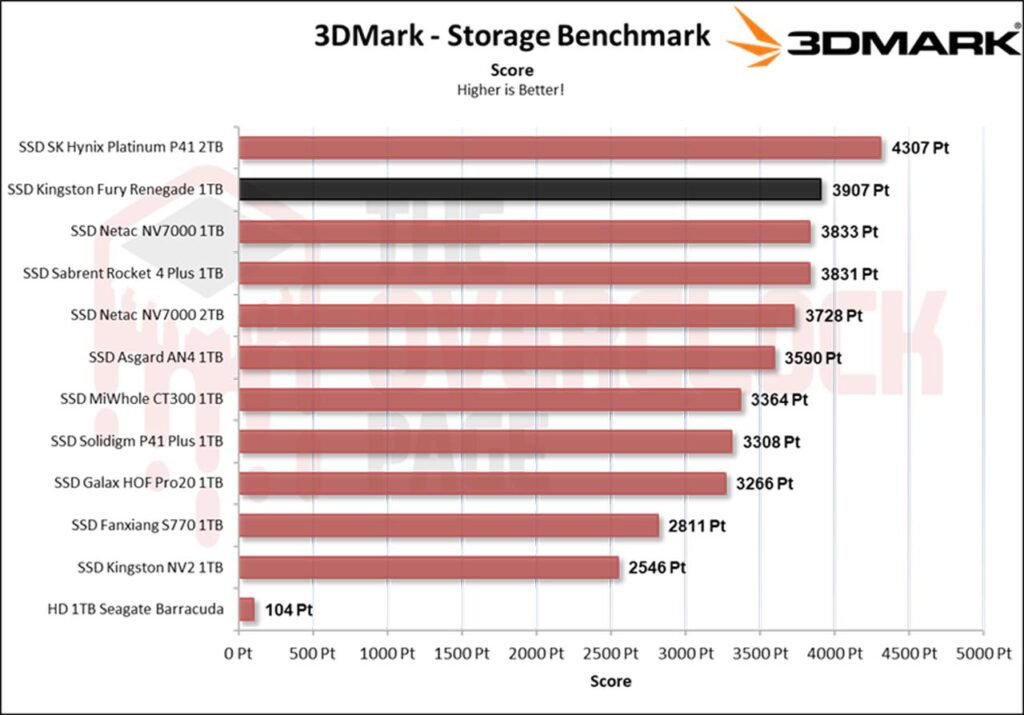
In this benchmark, various storage-related tests are conducted, including game loading tests for titles like Call of Duty Black Ops 4 and Overwatch. Additionally, it covers recording and streaming gameplay at 1080p 60 FPS using OBS, game installations, and file transfers within game folders.
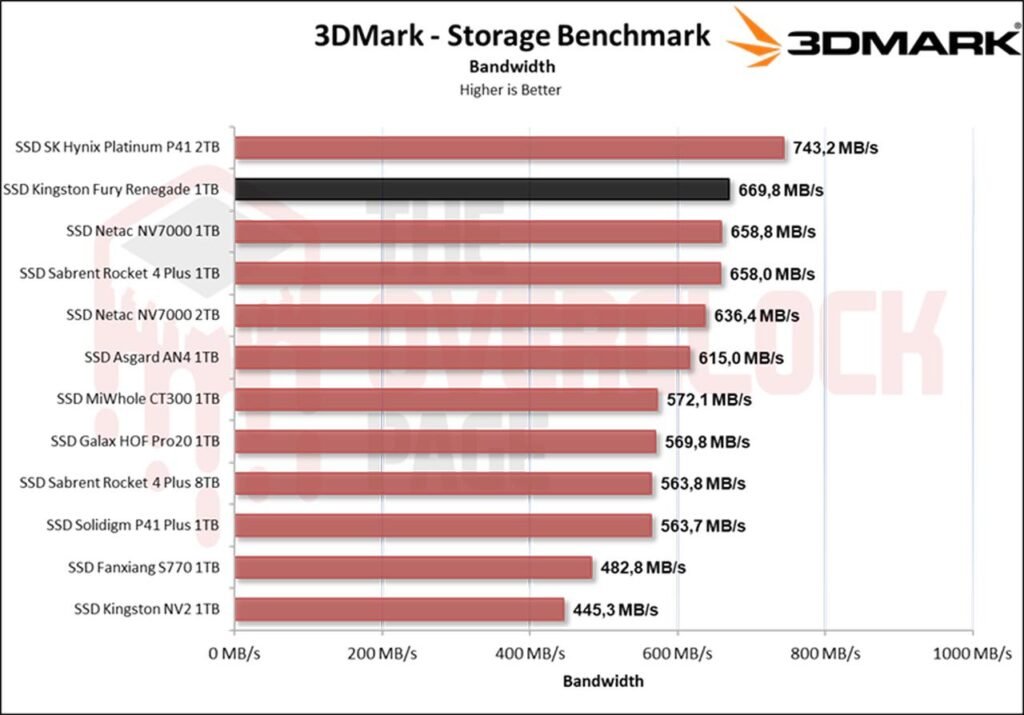
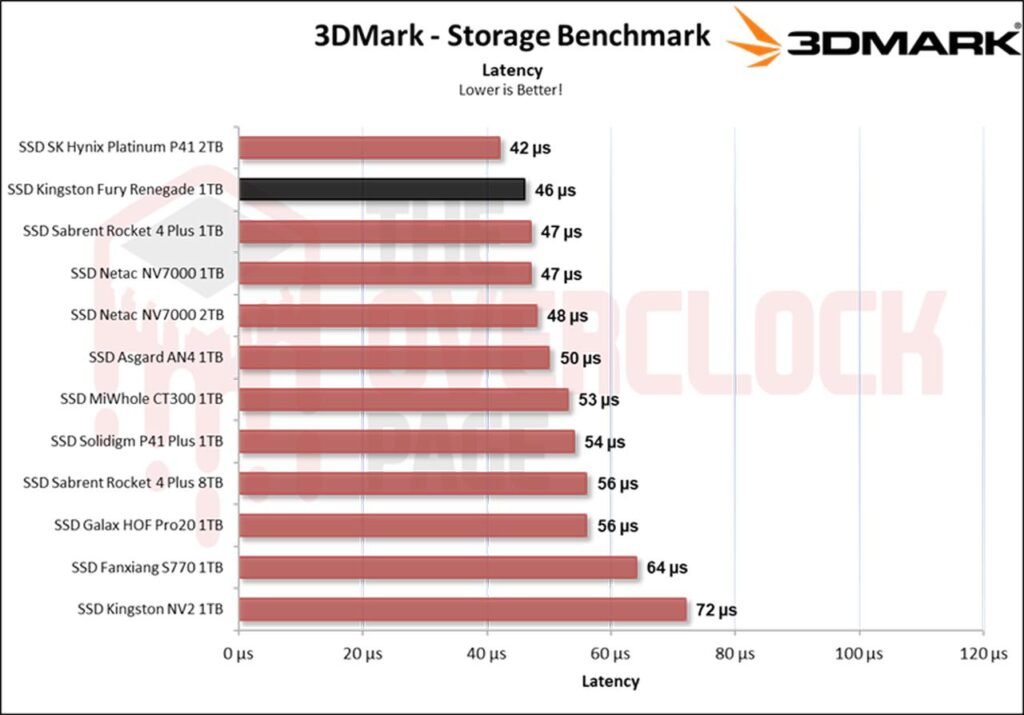
In this benchmark, which employs more realistic and traditional everyday usage traces, the Kingston unit delivered an IMPRESSIVE result, securing the second position in both latency and bandwidth aspects, showcasing remarkable performance.
PCMARK 10 – FULL SYSTEM DRIVE BENCHMARK
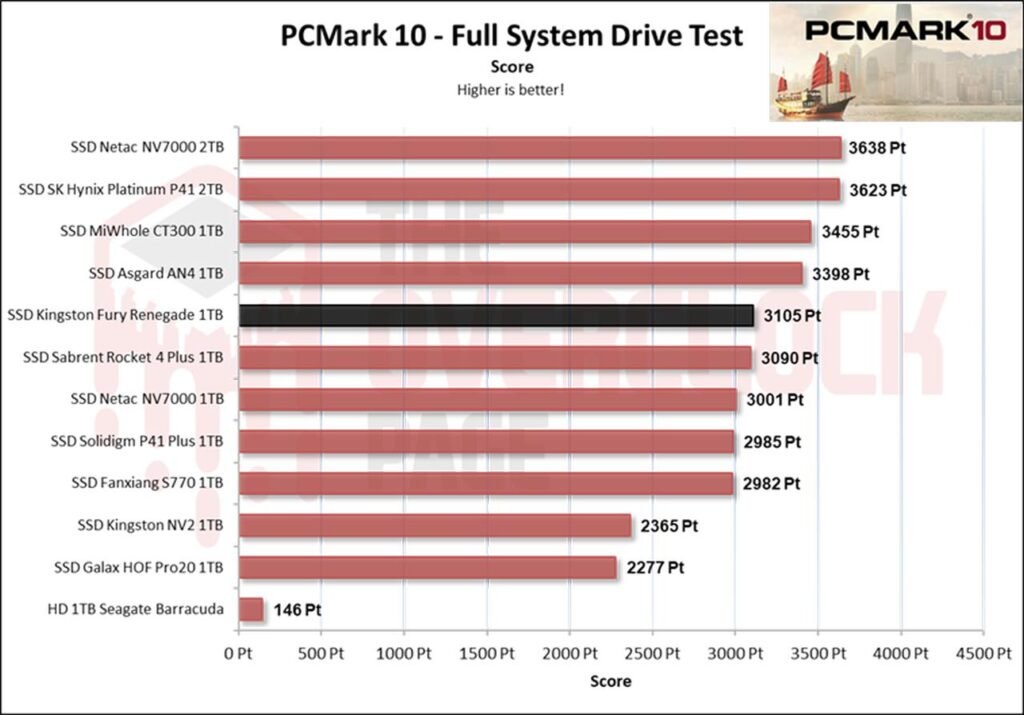
In this test, the Storage Test tool was employed, specifically the “Full System Drive Benchmark,” which conducts both light and heavy tests on the SSD.
Among these traces, we can observe tests such as:
- Boot Windows 10
- Adobe After Effects: Launching the application until it’s ready for use
- Adobe Illustrator: Launching the application until it’s ready for use
- Adobe Premiere Pro: Launching the application until it’s ready for use
- Adobe Lightroom: Launching the application until it’s ready for use
- Adobe Photoshop: Launching the application until it’s ready for use
- Battlefield V: Loading time until the start menu
- Call of Duty Black Ops 4: Loading time until the start menu
- Overwatch: Loading time until the start menu
- Using Adobe After Effects
- Using Microsoft Excel
- Using Adobe Illustrator
- Using Adobe InDesign
- Using Microsoft PowerPoint
- Using Adobe Photoshop (Heavy use)
- Using Adobe Photoshop (Light use)
- Copying 4 ISO files, totaling 20GB, from a secondary drive (Write test)
- Copying ISO file (Read-write test)
- Copying the ISO file to a secondary drive (Read)
- Copying 339 JPEG files (Photos) to the tested drive (Write)
- Creating copies of these JPEG files (Read-write)
- Copying 339 JPEG files (Photos) to another drive (Read)
These tests cover a wide range of scenarios and applications to evaluate the SSD’s performance in various real-world use cases.
In this other test, which is a slightly older benchmark with a greater focus on productivity, we can see that the SSD still managed to achieve a good result. However, it might not be as outstanding as the performance we observed in the previously conducted 3DMark test.
PROJECT – Adobe Premiere Pro 2021
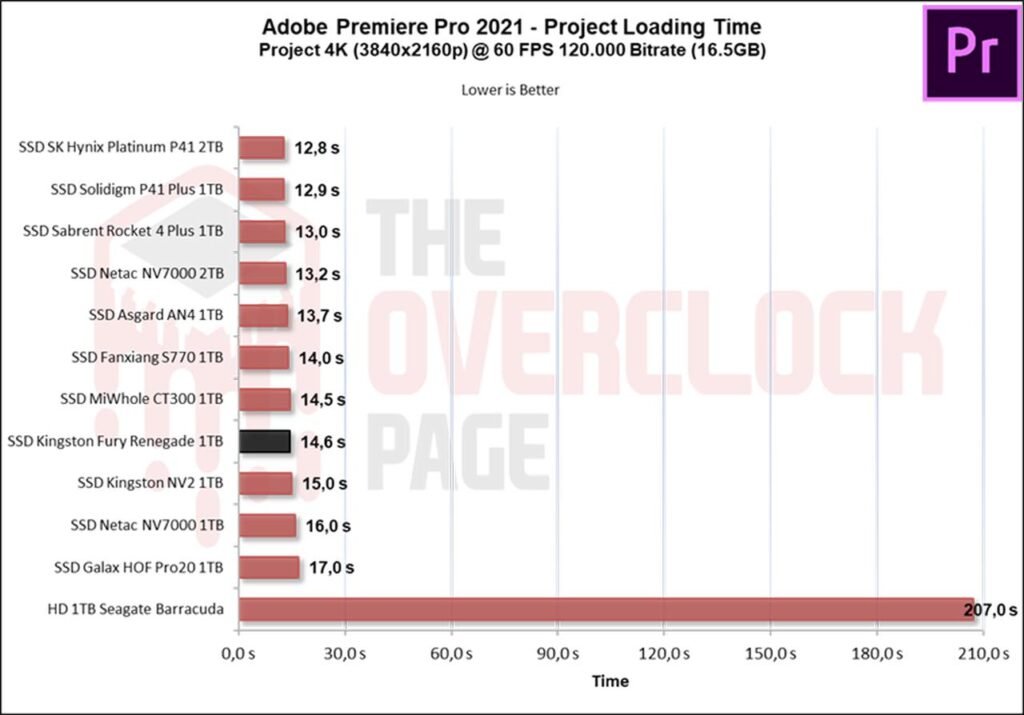
Next, we used Adobe Premiere to measure the average time it took to open a project of approximately 16.5GB with a 4K resolution and a bitrate of 120Mbps. The project was loaded with effects until it was ready for editing. It’s important to note that the tested SSD was used as a secondary drive without the operating system installed. This was done to avoid potential inconsistencies that could be caused by the presence of the OS.
When using Premiere to load a project of over 16GB, the Kingston SSD achieved a technical tie with the previously tested MiWhole CT300 SSD, which was also a great AliExpress SSD.
WINDOWS BOOT TIME AND LOADING TIMES
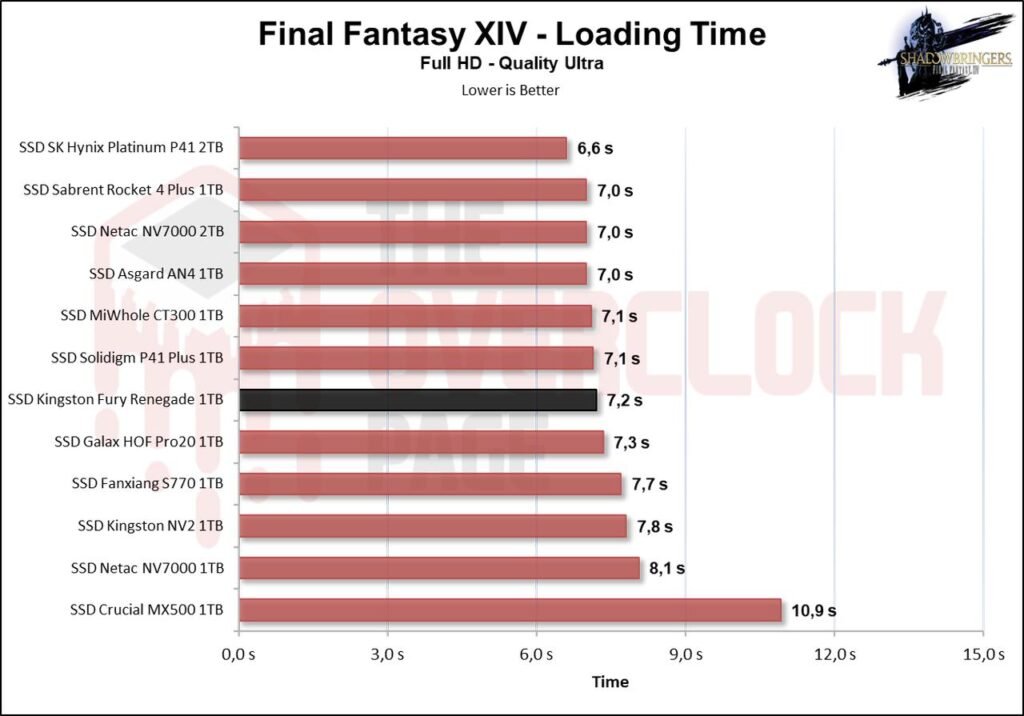
We conducted a comparison between multiple SSDs and an HDD, using a clean installation of Windows 10 Build 21H1 and the Final Fantasy XIV benchmark in campaign mode. The test involved the best result after three consecutive system boots, considering the total time until reaching the desktop area with the score provided by the application. It’s worth noting that this test is slower than the boot time until the desktop screen is displayed.
In this game, we can observe that the Kingston SSD exhibited performance very similar to the Solidigm P41 Plus during the loading of Final Fantasy.
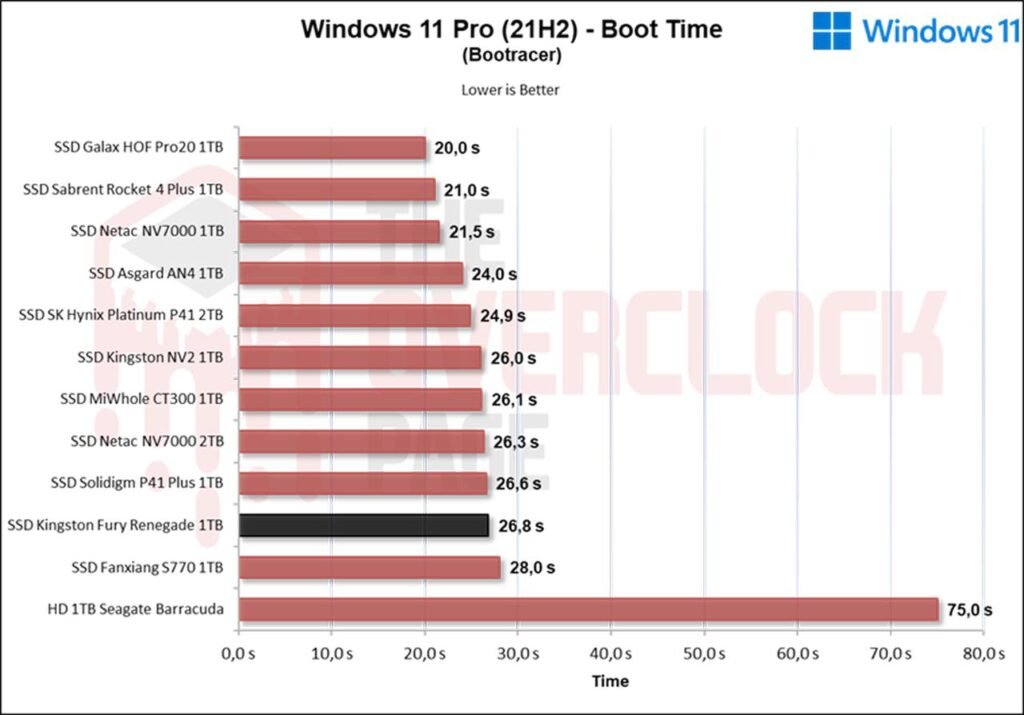
In this test, it covers the boot time until the loading of the latest OS drivers. In this case, a clean installation is done with only OS drivers such as Network, Wireless + Bluetooth, Audio, Nvidia drivers, PCH, among others. We can observe that the Kingston SSD once again achieved a technical tie with the Solidigm P41 Plus in this scenario.
SUSTAINED WRITE SPEEDS | SLC CACHING
A significant portion of SSDs in the current market utilizes the technology of SLC caching. This involves allocating a certain percentage of the storage capacity, whether it’s MLC (2 bits per cell), TLC (3 bits per cell), or QLC (4 bits per cell), to store only 1 bit per cell. In this case, it serves as a buffer for both writing and reading operations. The controller initiates writing, and when the buffer is exhausted, the data is then written to the native NAND flash (MLC/TLC/QLC).
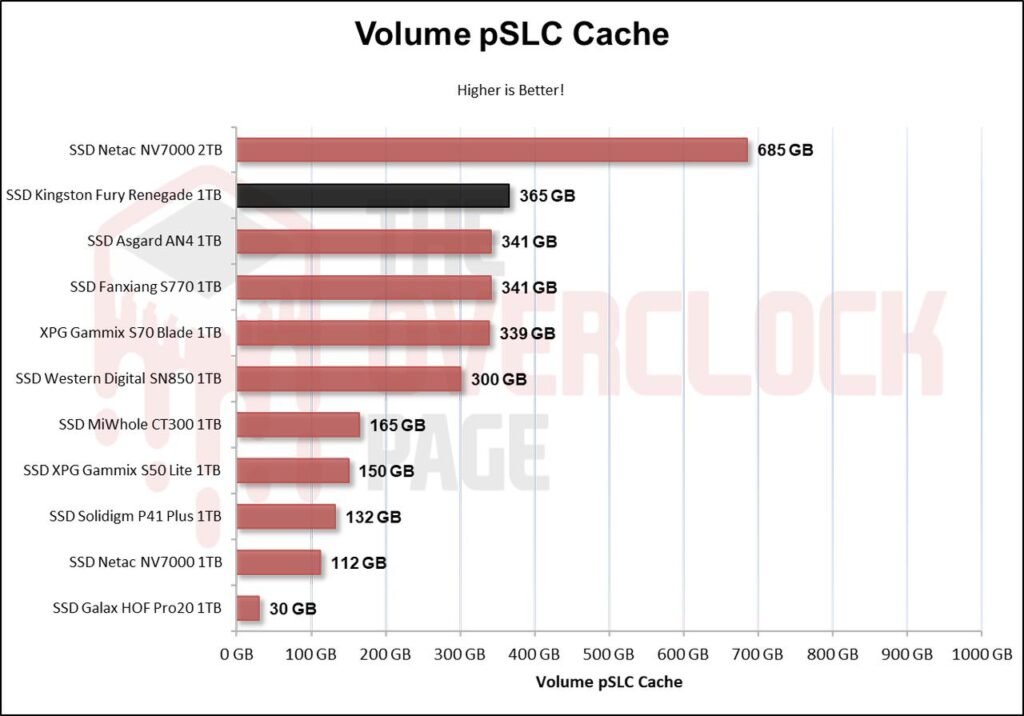
Through IOmeter, we can gain an understanding of the SLC cache volume of this SSD, especially when manufacturers don’t always provide this information. Based on the tests we conducted, it’s evident that the SSD has a dynamic pSLC cache of around 365GB. It managed to maintain an average speed of approximately 6090MB/s until the cache was exhausted. This speed is quite commendable, considering that this is a 1TB PCIe 4.0 SSD.
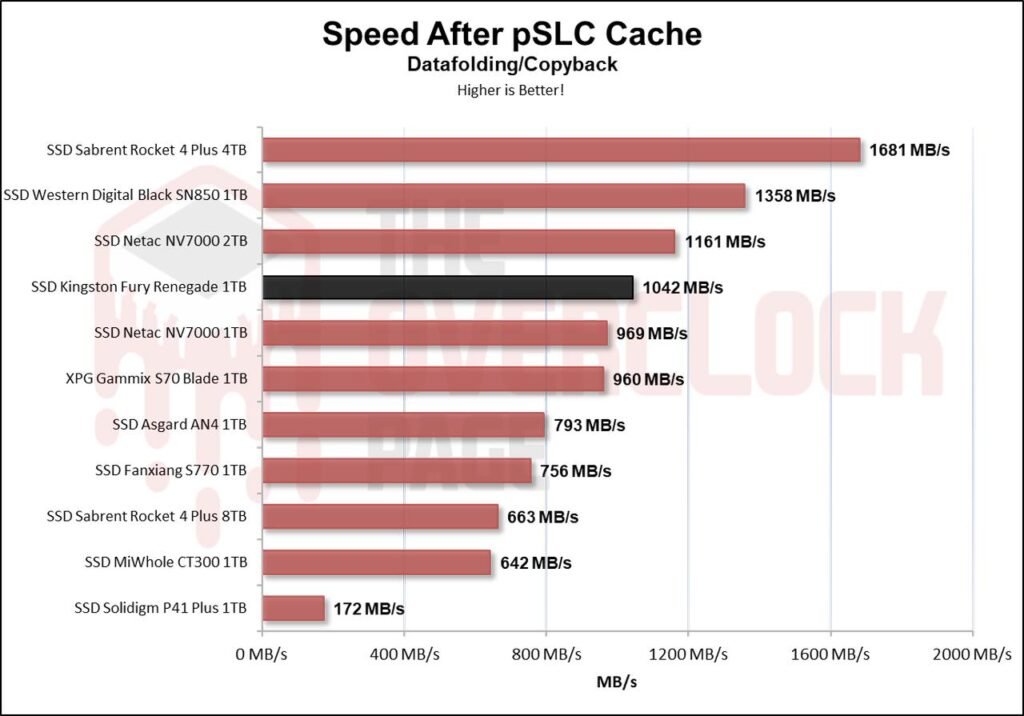
After writing 365GB, the SSD began the folding process, during which it reprogrammed the blocks that were in pSLC mode back to TLC mode. This resulted in a significant drop in performance. The SSD maintained an average write speed of 1042 MB/s until the drive was filled, which is quite impressive, especially for a 1TB unit.
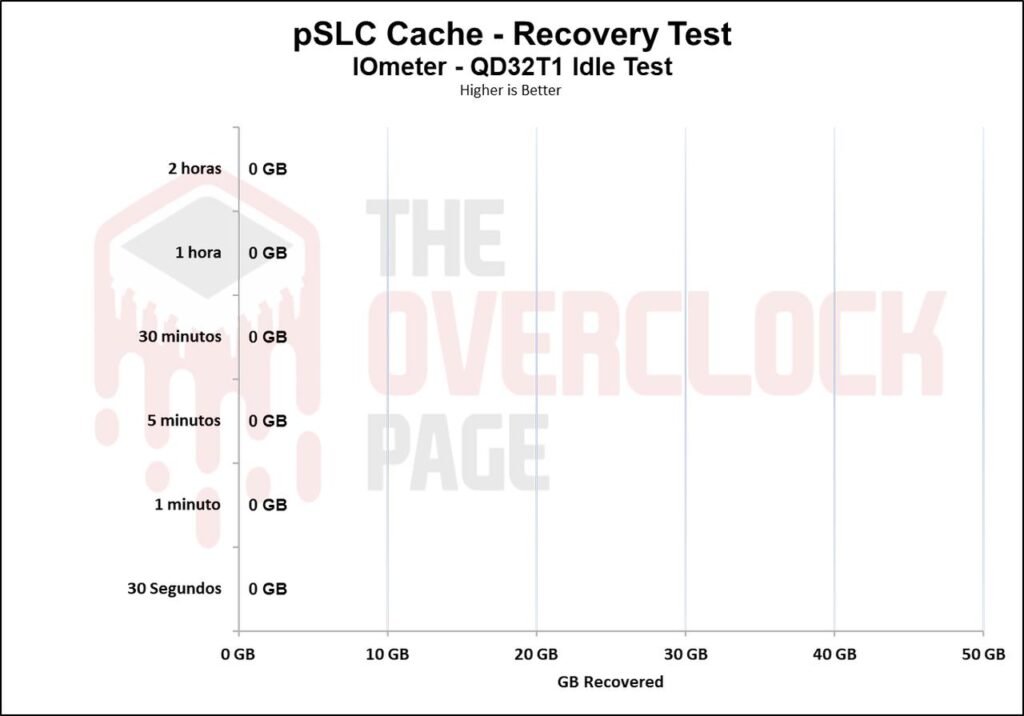
We also conducted a test to determine how long the SSD would take to recover part of its buffer. Throughout our test battery, which lasts from 30 seconds to 2 hours in idle mode, we used TRIM and garbage collection (GC) versus not using TRIM/GC. When testing without using TRIM/GC, we observed that it didn’t even recover 1 GB of SLC cache. However, it’s important to note that this is an entirely unrealistic scenario where the SSD has no initiated partitions and isn’t initialized, which is something nobody does in real usage. This test is purely for curiosity to see how the SSD performs in the worst possible scenario.
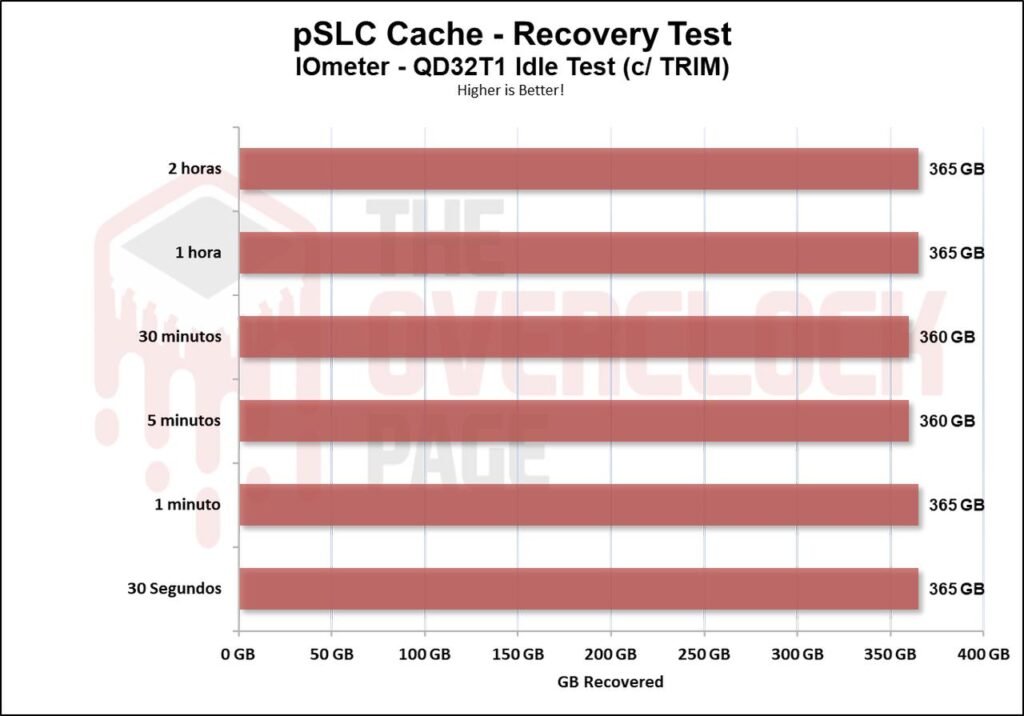
However, when testing with TRIM/GC activated, we can observe that it quickly recovers its full volume within a few seconds.
FILE TRANSFERS
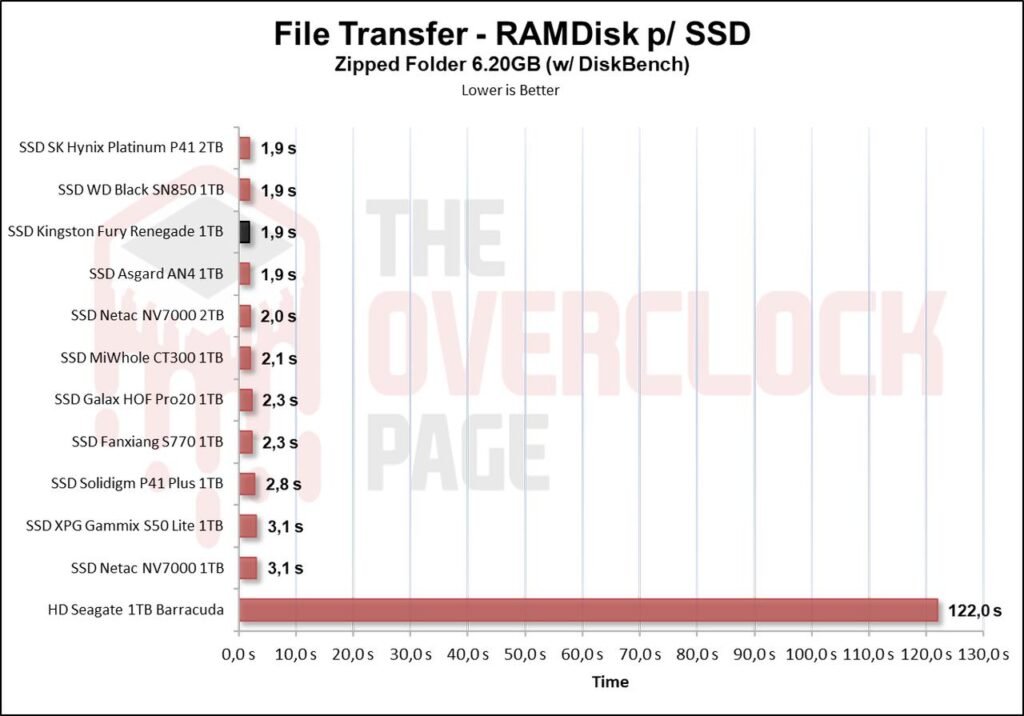
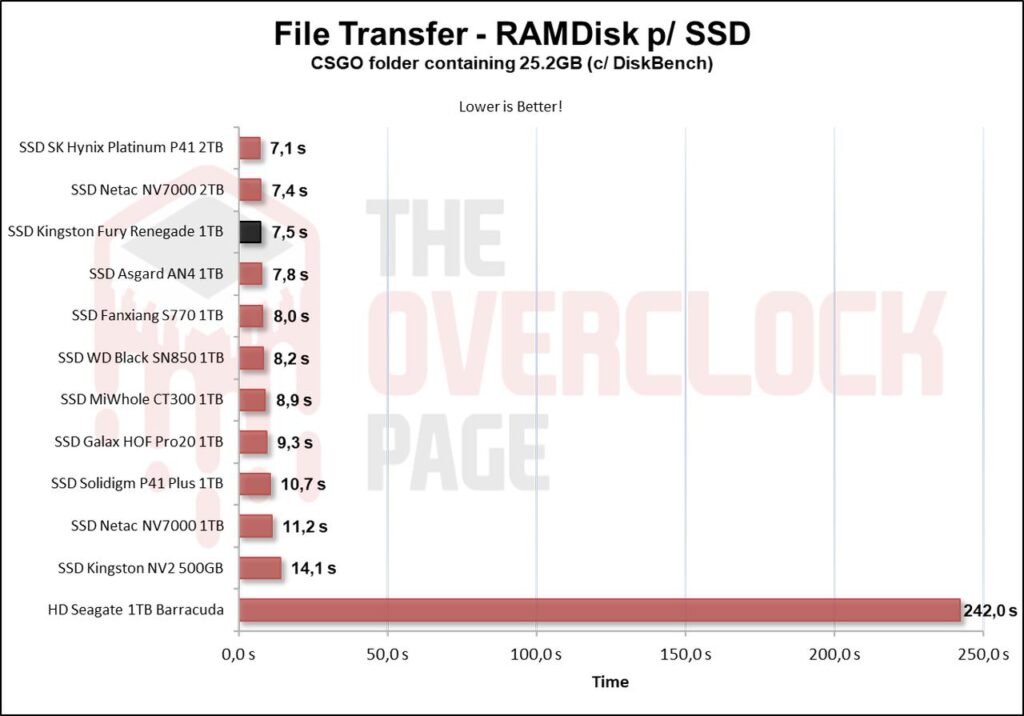
In this test, we copied ISO files and CSGO data from a RAM Disk to the SSD to evaluate its performance. The Windows 10 21H1 ISO file of 6.25GB (single file) and its extracted version with Winrar into a folder containing 1,874 smaller files were used. Additionally, the CSGO installation folder of 25.2GB was also part of the test.
When using the Windows 10 .ISO image, the Kingston SSD completes the transfer in less than 2 seconds, securing a podium position in the comparison.
When conducting the same test with a much larger game folder, the Kingston SSD remains among the top 3 performers in the comparison. This is largely attributed to its substantial SLC cache volume, which contributes to such test scenarios.
THERMAL TESTING
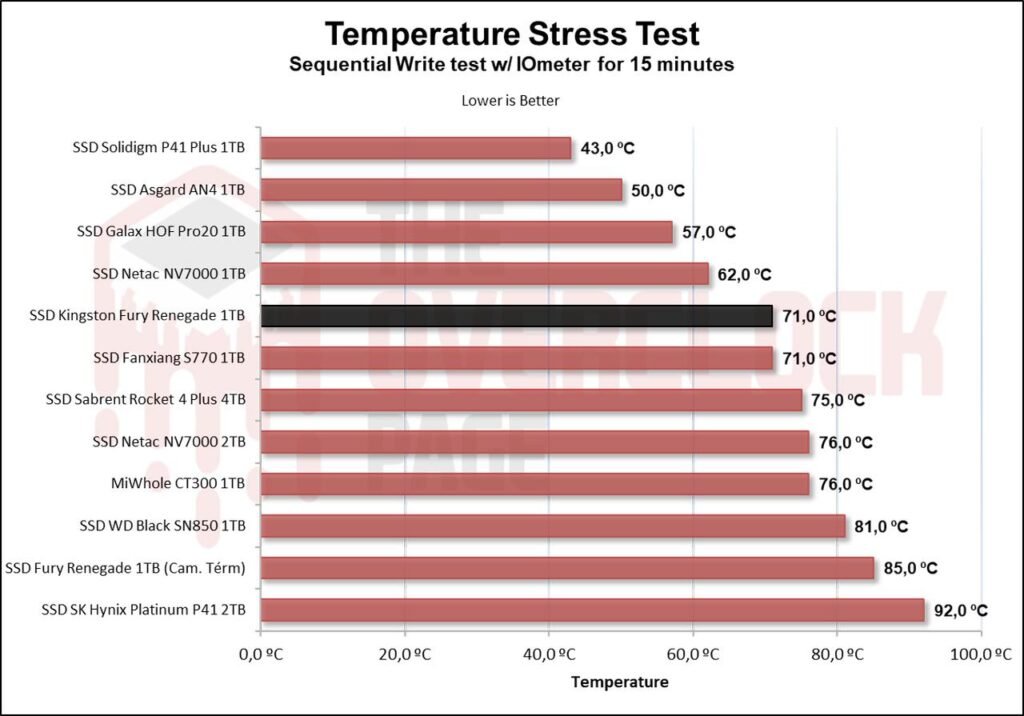
In this part of the analysis, we will be observing the temperature of the SSD during a stress test. In this test, the SSD continuously receives files to determine if there’s any thermal throttling occurring within its internal components that could lead to bottlenecks or performance loss.
As seen above, this SSD has a default thermal throttling limit set between 84°C and 89°C. This resulted in thermal throttling occurring during heavy or extended workloads. When reaching 85°C, as measured by a thermal camera, its write speed dropped to around 500 MB/s. Additionally, there seems to be a notable discrepancy between the temperature measured by the thermal camera and the temperature sensor on the SSD itself.
In the video above, we have a short time-lapse captured using an Infiray T3 thermal camera during a 15-minute stress test in IOmeter. The purpose of this was to observe which areas of the SSD’s PCB experience overheating.
POWER AND EFFICIENCY
Just like various other components in our system, SSDs also have a specific power consumption. The most efficient SSDs can perform tasks quickly with relatively low power consumption, allowing them to transition back to idle power states where consumption tends to be lower.
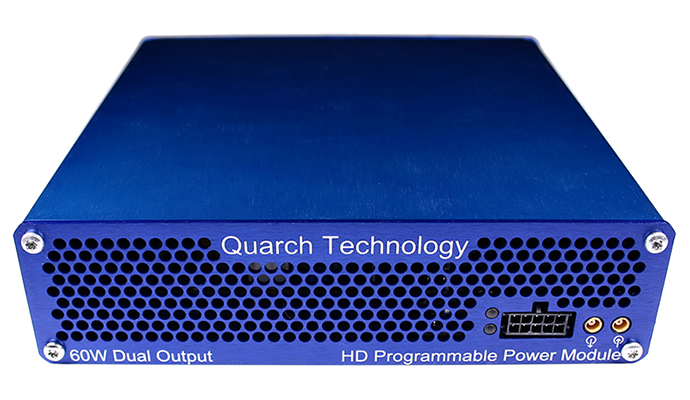
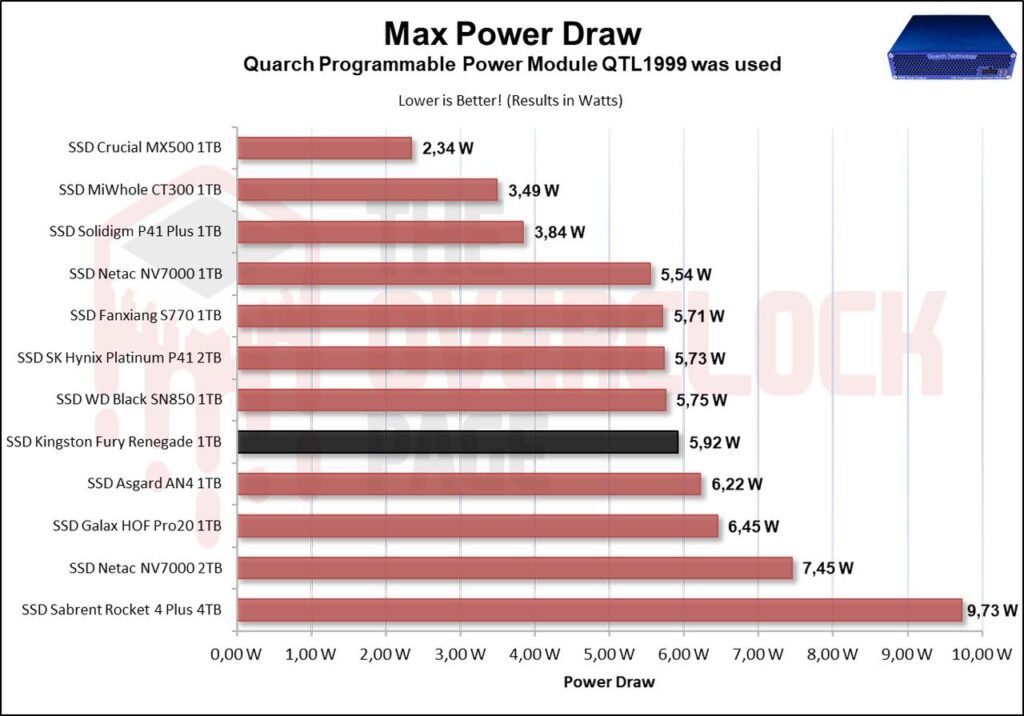
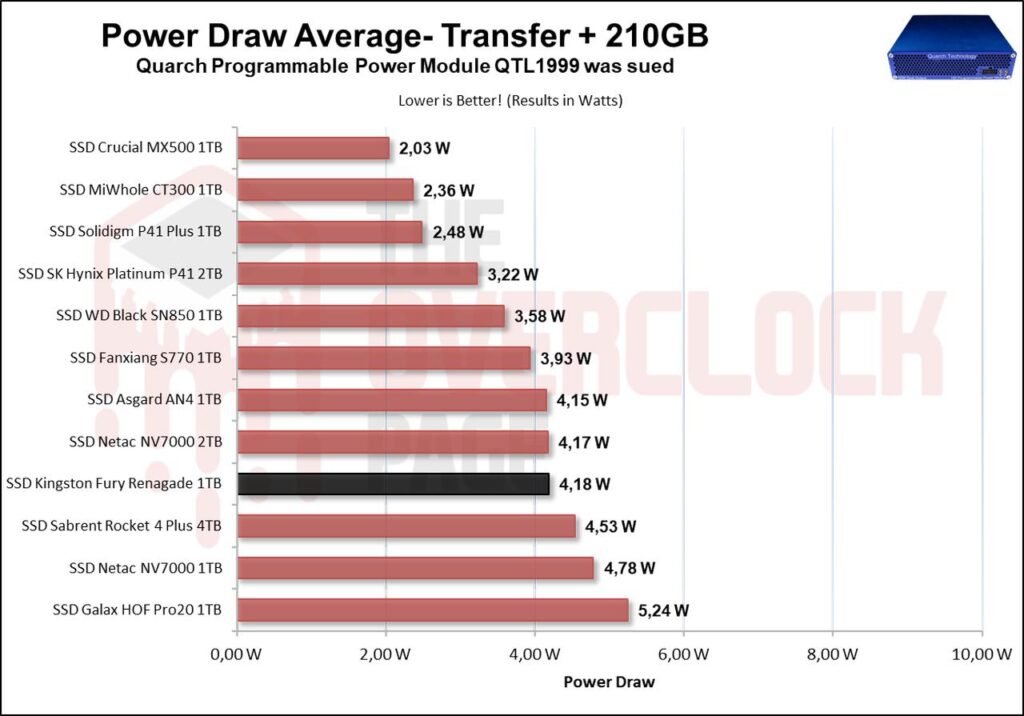
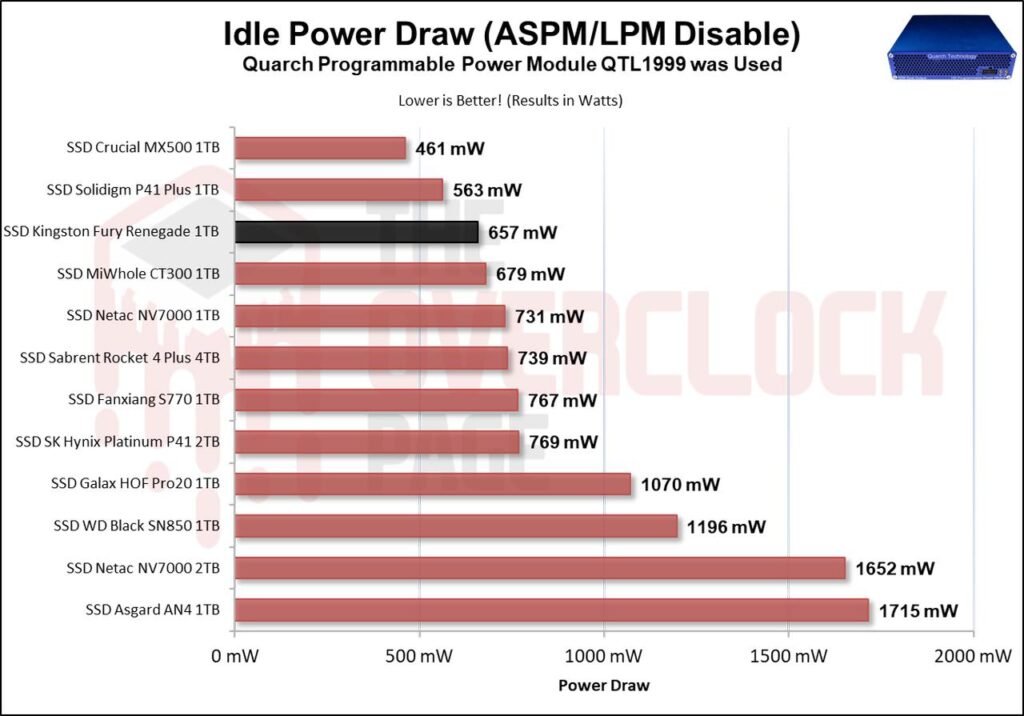
In this part of the analysis, we will use the Quarch Programmable Power Module, which Quarch Solutions provided, to conduct tests and determine the SSD’s efficiency. This methodology will involve three tests: measuring the SSD’s maximum power consumption, its average power consumption in practical and casual scenarios, and its power consumption during idle periods.
These tests, especially the efficiency and idle power consumption ones, are crucial for users intending to use the drives in laptops. SSDs spend the majority of their time in low-power states (Idle), so understanding these metrics is important for battery savings.
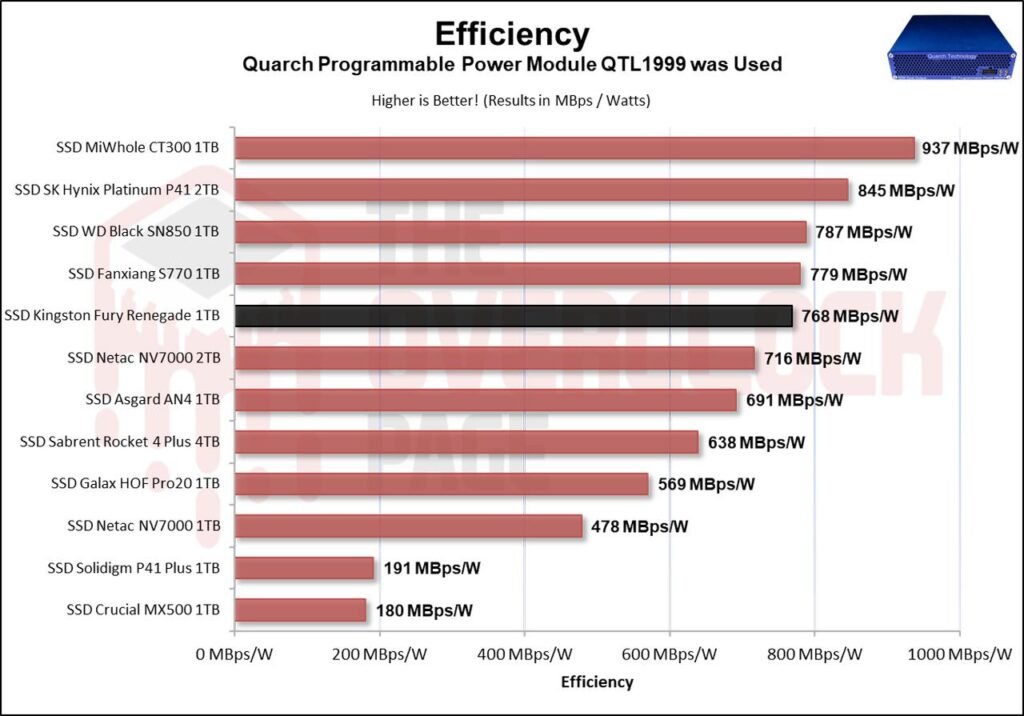
In terms of efficiency, the Kingston SSD performs quite well for a drive with the Phison E18 controller and Micron B47R NANDs. It only falls behind SSDs with proprietary controllers such as those from Western Digital or SK Hynix, and of course, the Maxiotech SSD. However, it’s important to note that the Maxiotech SSD has a controller with 4 communication channels compared to the 8 channels in the Phison controller used in the Kingston SSD.
Regarding its maximum power consumption, the Kingston SSD ended up being close to the 1TB SN850, being only 150mW higher. This can be considered an acceptable result, especially considering it’s a 1TB drive. Additionally, it remained well below the maximum allowed power consumption of 8.8W according to the PS0 power state.
In terms of average power consumption, the Kingston SSD showed a consumption of 4.18W, which is almost identical to the 2TB Netac NV7000 we tested. This is a positive result for a 1TB SSD.
Lastly and most importantly, in the idle test scenario – which represents the state where the majority of SSDs are during everyday usage – we can observe that the Kingston SSD is one of the PCIe 4.0 SSDs that achieves speeds of over 7GB/s with the lowest consumption observed so far. This is an impressive result, highlighting its efficiency during typical usage scenarios.
Conclusion
Taking all of this into consideration, is it really worth investing in this SSD?
Without a doubt! We receive a lot of inquiries from people looking for SSDs both in Brazil and on AliExpress, seeking SSDs that offer good performance and durability. Unfortunately, there has been a growing issue with Chinese SSDs featuring Innogrit controllers, causing a decline in the number of SSDs that are worth purchasing. However, both this SSD and the KC3000 are still great options.
However, the prices at which they are sold on AliExpress might not be as attractive. Therefore, if you’re considering buying an SSD like this one or the KC3000, we suggest purchasing directly at Amazon or Newegg, where you would have national warranty and a reduced likelihood of encountering issues.
ADVANTAGES
- High sequential speeds
- Satisfactory random speeds
- Excellent latencies
- Provides excellent practical performance, even in professional scenarios
- Uses a good combination of controller with TLC dies
- Basic management software
- Consistency in internal components, and a version with included heatsink
- Huge pSLC cache size
- Great post-SLC cache speed
- Good level of durability, above average (TBW) 700TB vs 1000TB
- SSD with extremely low power consumption at idle, great for notebooks
- Good energy efficiency
- Competitive price
DISADVANTAGES
- Suffers thermal throttling under heavy or extended loads
- SLC Cache takes time to recover
- High price on AliExpress, more cost-effective at Amazon or Newegg
- Does not have encryption


