Review – SSD AIGO SMI70 – SM2268XT – Another contestant for the MAP1602!
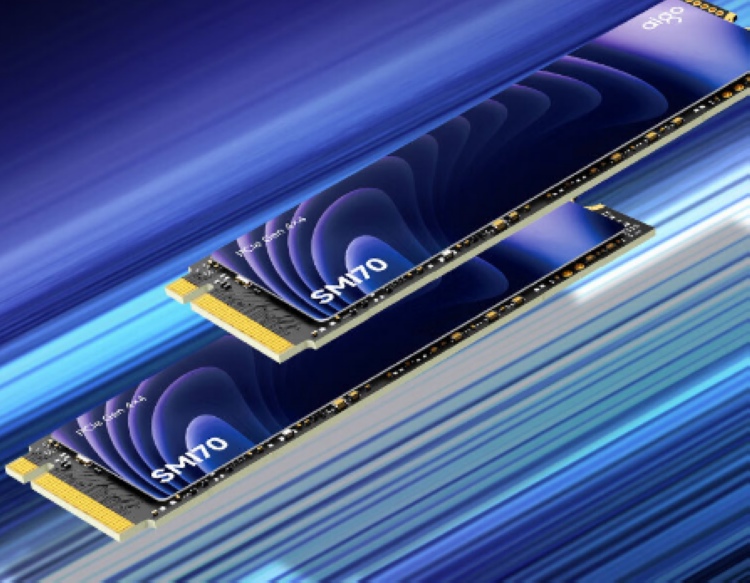
Today, we’ll be testing an NVMe SSD from AIGO, a top-of-the-line model called SMI70, which Silicon Motion themselves have sent us to test. Thank you 🙂
It comes in the M.2 form factor with a 64Gbps interface, meaning 4 PCIe 4.0 lanes, NVMe 2.0 protocol, and capacities ranging from 1TB to 4TB. Its price is unknown and it´s only available in the Asian market as far as we could verify.
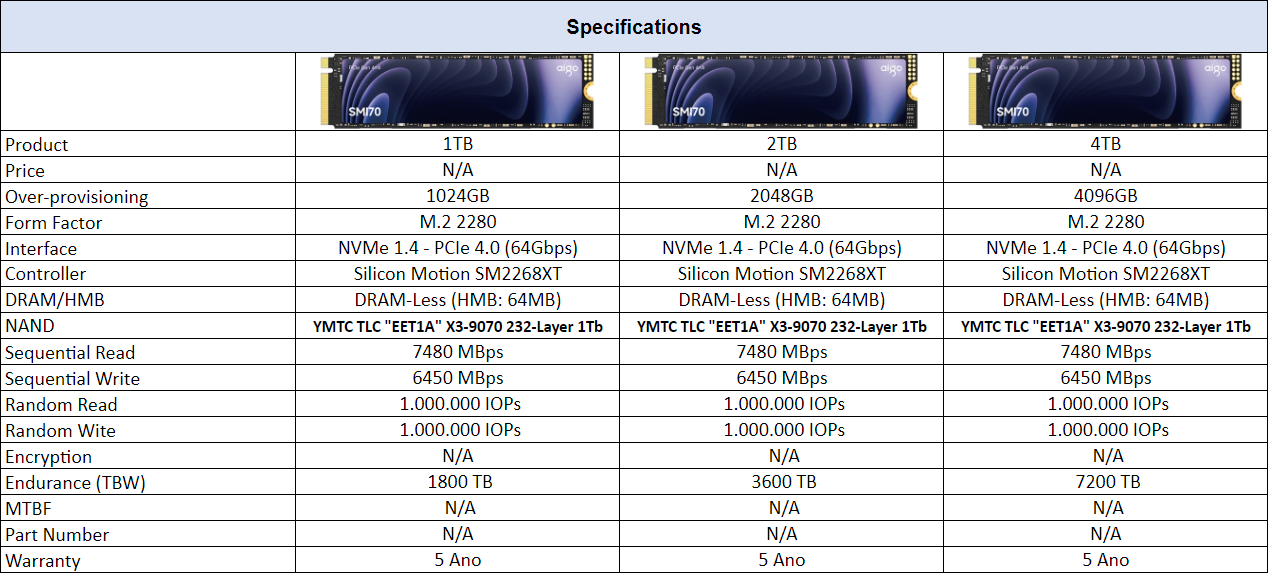
Specifications AIGO SMI70
Below are more detailed specifications about the SSD being tested (2TB unit):
SSD’s Software
Unfortunately, these SSDs do not come with proprietary software, requiring third-party programs for management.
Unboxing
On the front side of the box, we have the SSD model name, manufacturer, capacity, and a Silicon Motion logo, indicating the controller used in this SSD. On the back side, there’s a cutout in the box that allows us to see the SSD through transparent plastic.


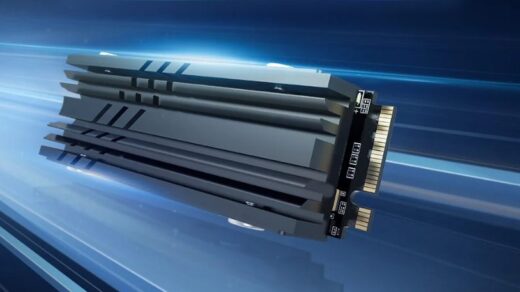
The SSD on its front side features a “thin heatsink,” which may not contribute significantly to heat dissipation. This aspect will be tested as part of the analysis.


This SSD has a single-sided design, meaning it only has components on one side of the PCB, which facilitates cooling and improves compatibility with some laptop designs.

On its front PCB, we have the controller chip, 2 NAND flash modules, and various components of the SSD’s VRM, which we will also discuss.
Controller
The SSD controller is responsible for managing data, over-provisioning, garbage collection, among other background functions. And, of course, this contributes to the SSD’s overall performance.
This SSD utilizes a controller from Silicon Motion: the new SM2268XT model. It’s an ARM 32-bit dual-core Cortex® R8 controller operating at a frequency of 725MHz, which is slightly higher than its predecessor, the SM2269XT. Despite its name, the SM2269XT is actually a dual-core Cortex-R8 controller operating at 650 MHz and offers lower sequential speeds of up to 5GB/s. These details were provided directly by Silicon Motion.
It features a 12nm manufacturing process by TSMC, similar to solutions from other well-known manufacturers like Phison and Maxiotech. This DRAM-Less controller utilizes technologies such as H.M.B. to store metadata tables.
In addition, it supports 4 channels with a bus speed of up to 2400 MT/s, which is a notable feature. Many DRAM-Less Gen4 controllers with 4 channels typically support up to only 1600 MT/s. It provides support for up to 16 dies using “Chip enable” commands, meaning 16 Chip Enables, which are direct and physically connected to the dies. As we will see shortly, its NAND Flash operates at 2400 MT/s.
Something curious is that this controller was specially developed to operate in the high-performance DRAM-Less controller market, competing head-to-head with the well-known and widely used MaxioTech MAP1602, as well as the new contender Phison E27T. Although it is “only” a Dual Core controller compared to the Quad Core MAP1602, Cortex-R8 cores tend to have higher performance than Cortex-R5, which may give this controller a certain advantage, albeit at the cost of higher power consumption.
Another curiosity is that the SM2268XT has two versions, the SM2268XT and the SM2268XT2, which are basically the same controller, with the difference that the SM2268XT2 supports NVMe 2.0 and channels up to 3200 MT/s. Up to the time of this analysis, no NAND Flash on the market operates at speeds above 2400 MT/s, as is the case with the two main ones, the YMTC EET1A 232-Layers and the Micron B58R.
DRAM Cache or H.M.B.
Every top-of-the-line SSD that aims to deliver consistent high performance requires a buffer to store its mapping tables (Flash Translation Layer or Look-up table). With this, it can achieve better random performance and be more responsive.
As mentioned earlier, being a DRAM-Less controller, it doesn’t support DRAM Cache. Therefore, to store the metadata table, it allocates 64 MiB of system RAM to expedite access to this table.
NAND Flash
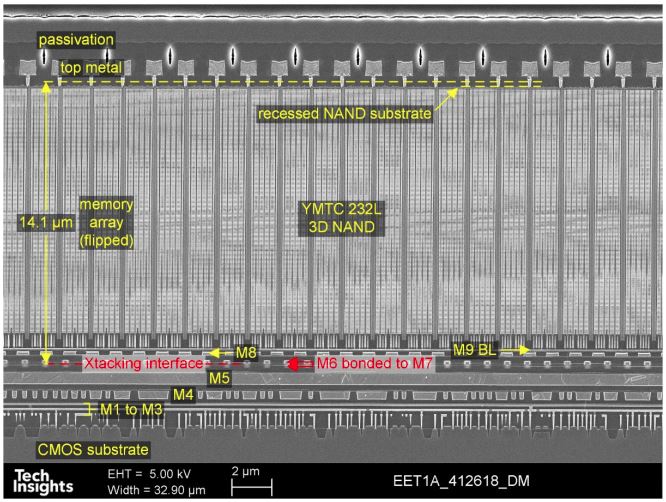
In terms of its storage integrated circuits, the 2TB SSD features 2 NAND flash chips from the Chinese manufacturer YMTC, model YMC6G008Tb78CA1C3. These are 1Tb dies (128GB) containing 232 layers of data and a total of 253 gates, resulting in an array efficiency of 91.7%. Of the 253 layers in the SSD, 232 are allocated for storage, generating this efficiency.

In this SSD, each NAND Flash has 8 dies with 1Tb of density, totaling 1TB per NAND, resulting in a total of 2TB. They communicate with the controller using a maximum bus speed of 2400 MT/s for improved performance.
Each of these dies has 6 planes so that when the controller accesses each die, it can increase parallelism and thus performance. It is important to highlight that this represents a significant performance increase compared to previous models from YMTC, which had 128 layers.
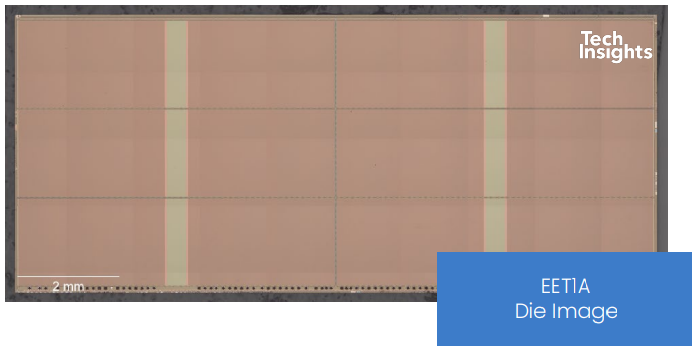
The new dies have 2 decks, totaling 253 layers (Gates), with 232 layers allocated for storage. Their density increased from 512Gb (128-Layers CDT1B and CDT2A) to 1Tb (EET1A), resulting in a tremendous increase in die density. The previous dies had sizes of approximately 60.42 mm² (CDT1B) and 59.93 mm² (CDT2A), while these new dies (EET1A) have a size of 68.15 mm², showing a significant density increase from 8 Gb/mm² to over 15.03 Gb/mm².
PMIC (Power Delivery)
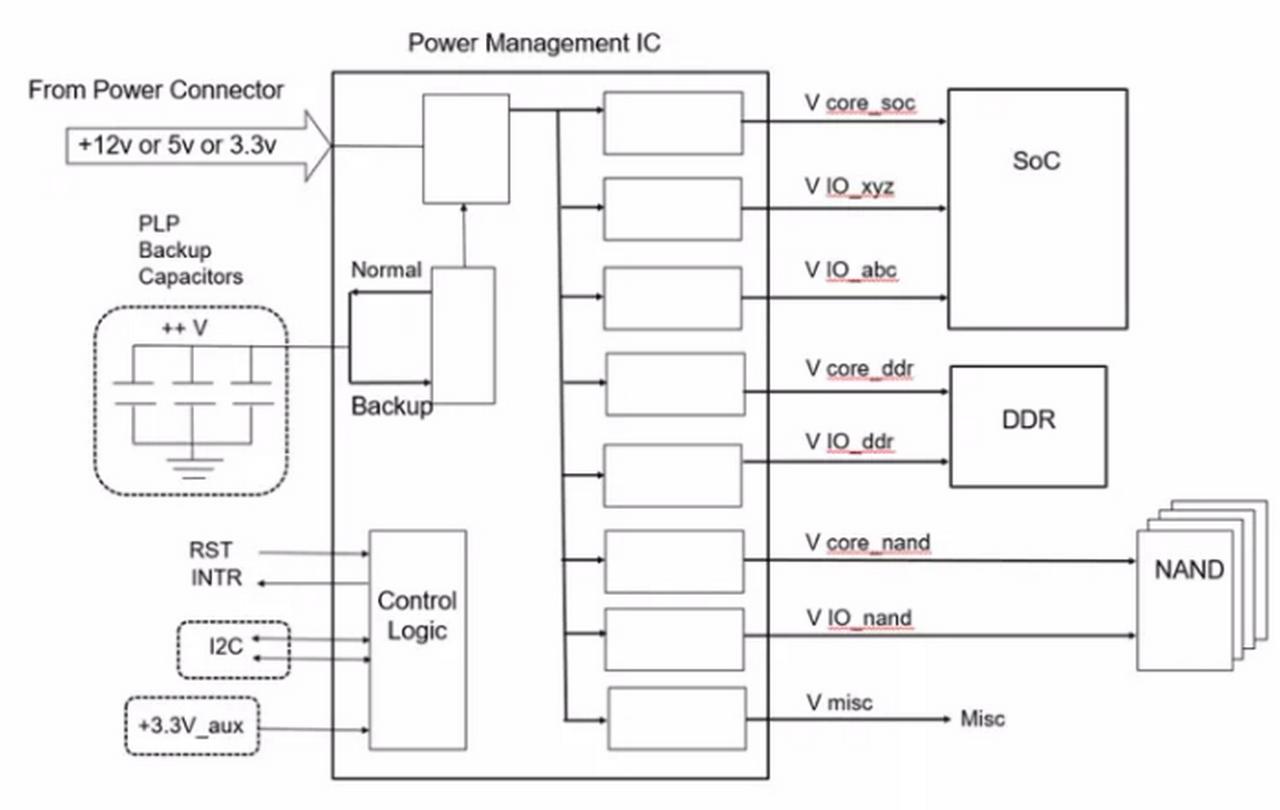
Like any electronic component that performs work, SSDs also have a level of power consumption that can vary from a few milliwatts to nearly 10 watts, approaching the limit of some connectors or slots. The circuit responsible for all power management is the PMIC, which stands for “Power Management IC,” a chip responsible for providing power to other components.


In this SSD, we find several ICs marked as P36D3, which is a remarking, and apparently, it is a Load Switch, although it was not possible to identify the exact manufacturer and model. Similarly to the P05GKo.
SSD Power States
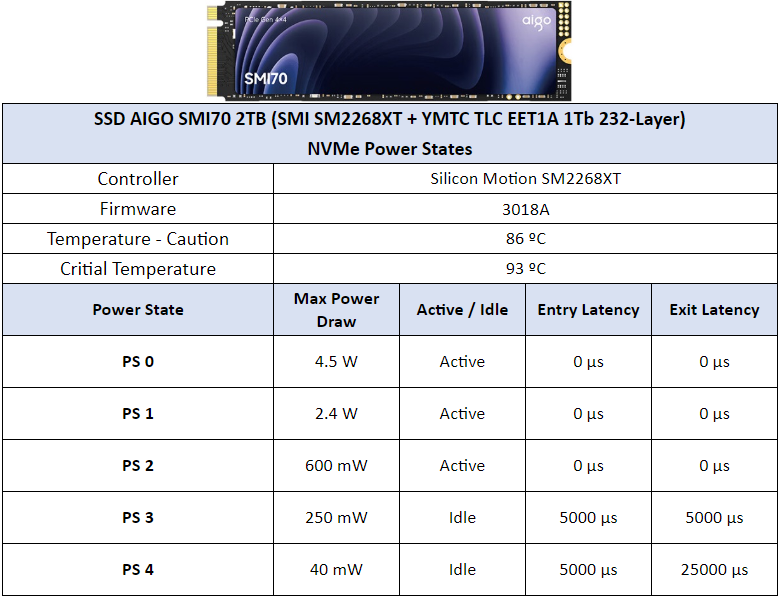
As we always mention in power consumption analyses, in this section, we will explore further the power states of this SSD.
Of the 5 power states it has, there are 3 active states with excellent latencies and 2 idle states with higher latencies. Another curious aspect to note is that the manufacturer has configured the SSD with a reasonable thermal throttling temperature range, between 86ºC and 93ºC, unlike other SSDs we’ve tested, which have ridiculously high temperatures of over 100ºC.
CURIOSITIES ABOUT THE SSD AIGO SMI70
Just as integrated circuits in a RAM module can vary, the same happens with SSDs, where there are cases of changes in components such as controllers and NAND flash chips.
Up to the time of this analysis, no other variants of this same SSD have been found.
TEST BENCH
– OS: Windows 11 Pro 64-bit (Build: 23H2)
– CPU: Intel Core i7 13700K (5.7GHz all core) (E-cores e Hyper-threading desabled)
– RAM: 2 × 16 GB DDR4-3200MHz CL-16 Netac (c/ XMP)
– Motherboard: MSI Z790-P PRO WIFI D4 (Bios Ver.: 7E06v18)
– GPU: RTX 4060 Galax 1-Click OC (Drivers: 537.xx)
– (OS Drive): SSD Solidigm P44 Pro 2TB (Firmware: 001C)
– DUT SSD: SSD AIGO SMI70 2TB (Firmware: 3018A)
– Chipset Driver Intel Z790: 10.1.19376.8374.
– Windows: Indexing disabled to avoid affecting test results.
– Windows: Windows updates disabled to avoid affecting test results
– Windows: Most Windows applications disabled from running in the background.
– Boot Windows: Clean Image with only Drivers
– Test pSLC Cache: The SSD is cooled by fans to prevent thermal throttling, ensuring it doesn’t interfere with the test results.
– Windows: Antivirus disabled to minimize variation in each round.
– DUT SSDs: Used as a secondary drive, with 0% of space being utilized, and other tests conducted with 50% of space utilized to represent a realistic scenario.
– Quarch PPM QTL1999 – Power consumption test: conducted with three parameters—idle, where the drive is left as a secondary, and after a period of idle, a one-hour write test is performed, and the average power consumption is recorded
WHERE TO BUY
As of the time of this analysis, this SSD is not yet available for purchase on the market, neither domestically nor on sites like AliExpress.
CRYSTALDISKMARK
We conducted synthetic sequential and random tests with the following configurations:
Sequential: 2x 1 GiB (1 MiB Blocks) 8 Queues 1 Thread
Random: 2x 1 GiB (4 KiB Blocks) 1 Queue 1/2/4/8/16 Threads


In these sequential tests, the SM2268XT ends up being quite similar to other controllers like the MAP1602 and others from Phison.


In terms of latency, it performed impressively, especially in read operations, where it showed the lowest latency so far. In writing, it also performed well, although it didn’t outperform as much as in reading.

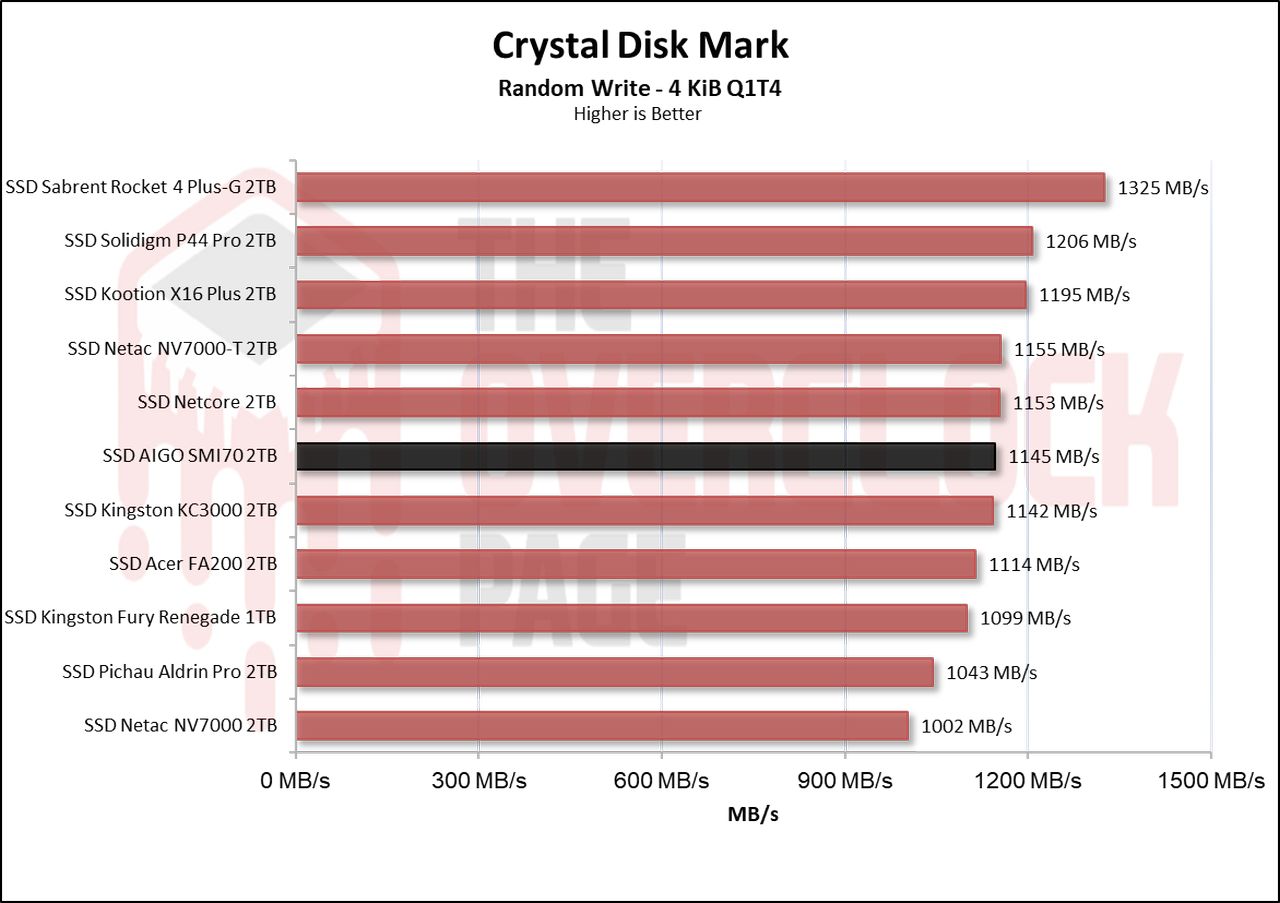
We observed the same impressive result in its read speed when testing its random speeds at QD4; it nearly reached 390MB/s. In terms of write speed, it also showed good results, although it didn’t achieve the best result as it did in reading.

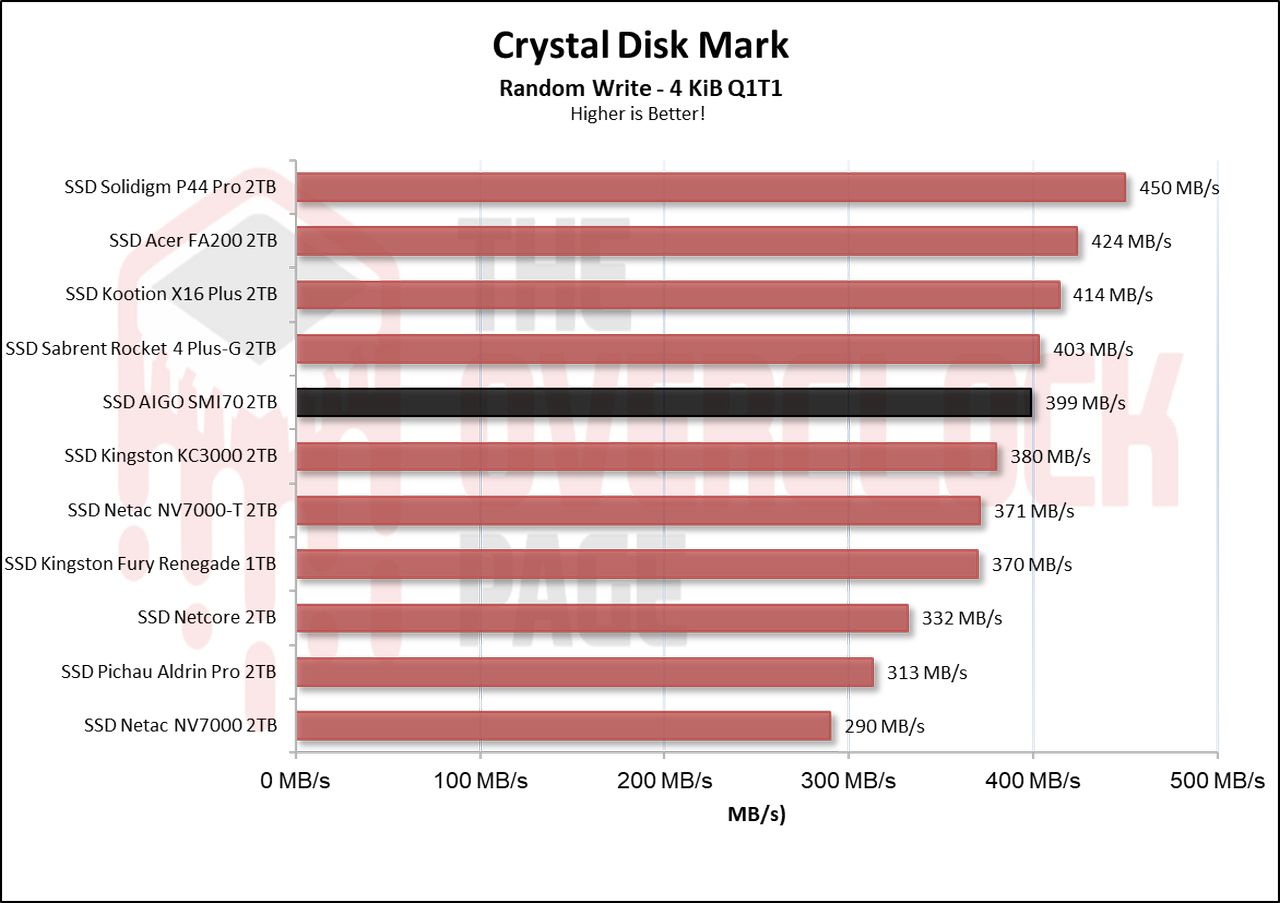
Again, now at QD1, we see this incredible result in its read speed where it even managed to break an average of 100 MB/s, which is not easy to achieve. And its write speed also showed a good result.
ATTO Disk Benchmark QD1 and QD4
We conducted a test using ATTO to observe the speed of the SSDs at specific block sizes. In this benchmark, the setup was as follows:
Blocks: from 512 Bytes to 8 MiB
File Size: 256MB
Queue Depth: 1 and 4.


The ATTO Disk Benchmark is a software that performs a sequential speed test with compressed files, simulating data transfer loads as in Windows. Typically, we observe block sizes ranging from 128KB to 1 MiB. Now, we can see that both in reading and writing, the SSD performs well compared to the other SSDs in the comparison.
Although in its writing, we see that at the beginning of the test it falls below other SSDs, as the test progresses, it manages to catch up with them.


Now, at QD1, we see a different scenario in its reading; it surged ahead significantly, far ahead of other SSDs. However, as the benchmark progresses, it ends up equalizing with the others. We’re starting to notice this reading pattern at low QDs, where it’s been showing incredible results. As for writing, it remained in line with the others in the comparison.
3DMark – Storage Benchmark
In this benchmark, various storage-related tests are conducted, including game loading tests like Call of Duty Black Ops 4 and Overwatch, recording and streaming with OBS of gameplay at 1080p 60 FPS, game installations, and file transfers of game folders.


In this benchmark suite, we see that this controller and NAND kit performs similarly to the MAP1602 + YMTC kit, although it shows slightly lower performance.
PCMARK 10 – FULL SYSTEM DRIVE BENCHMARK
Here, the Storage Test tool and the “Full System Drive Benchmark” were used, which conduct both light and heavy tests on the SSD.
Among these traces, we can observe tests such as:
- Boot Windows 10
- Adobe After Effects: Launching the application until ready for use
- Adobe Illustrator: Launching the application until ready for use
- Adobe Premiere Pro: Launching the application until ready for use
- Adobe Lightroom: Launching the application until ready for use
- Adobe Photoshop: Launching the application until ready for use
- Battlefield V: Loading time until the start menu
- Call of Duty Black Ops 4: Loading time until the start menu
- Overwatch: Loading time until the start menu
- Using Adobe After Effects
- Using Microsoft Excel
- Using Adobe Illustrator
- Using Adobe InDesign
- Using Microsoft PowerPoint
- Using Adobe Photoshop (Intensive use)
- Using Adobe Photoshop (Lighter use)
- Copying 4 ISO files, totaling 20GB from a secondary disk (Write Test)
- Performing the copy of the ISO file (Read-Write Test)
- Copying the ISO file to a secondary disk (Read)
- Copying 339 JPEG files (Photos) to the tested disk (Write)
- Creating copies of these JPEG files (Read-Write)
- Copying 339 JPEG files (Photos) to another disk (Read)
In this benchmark, with a greater focus on writing, we see the same result as in the 3DMark, it ends up being slightly below the MAP1602+YMTC.
Adobe Premiere Pro 2021
Next, we used Adobe Premiere to measure the average time it took to open a project of approximately 16.5GB with 4K resolution, 120Mbps bitrate, full of effects, until it was ready for editing. It’s worth noting that the tested SSD was always used as a secondary drive without the operating system installed, as this could affect the result, causing inconsistencies.
When using Premiere to load a project of over 16GB, we noticed that it had the longest loading time for the project. However, it still remained close to other SSDs, which is a satisfactory result.
GAME LOADING TIME AND WINDOWS BOOT
Here we have a comparison between multiple SSDs and a HDD, using a clean installation of Windows 10 Build 23H2 along with the Final Fantasy XIV benchmark opening the campaign mode. The test involves the best result after three consecutive system boots, considering the total time until it finishes on the desktop with the score reported by the application. Therefore, it is slower than the boot until the desktop screen is displayed.
When testing game loading times, we see that in this benchmark, it presents more consistent results with SSDs of similar construction.
In this program, it includes the time from boot to the loading of the latest OS drivers, which in this case, is performed with a clean installation including only operating system drivers such as Network, Wireless + Bluetooth, Audio, Nvidia Drivers, PCH, among others. We are pleased to see that it had one of the shortest loading times so far, coming in at 15 seconds.
SLC CACHING
Indeed, many SSDs on the market today utilize SLC caching technology, where a certain percentage of their storage capacity, whether it’s MLC (2 bits per cell), TLC (3 bits per cell), or QLC (4 bits per cell), is used to store only 1 bit per cell. In this case, it serves as a buffer for both writing and reading operations. When the buffer fills up, the controller initiates writing to the native NAND flash memory (MLC/TLC/QLC).
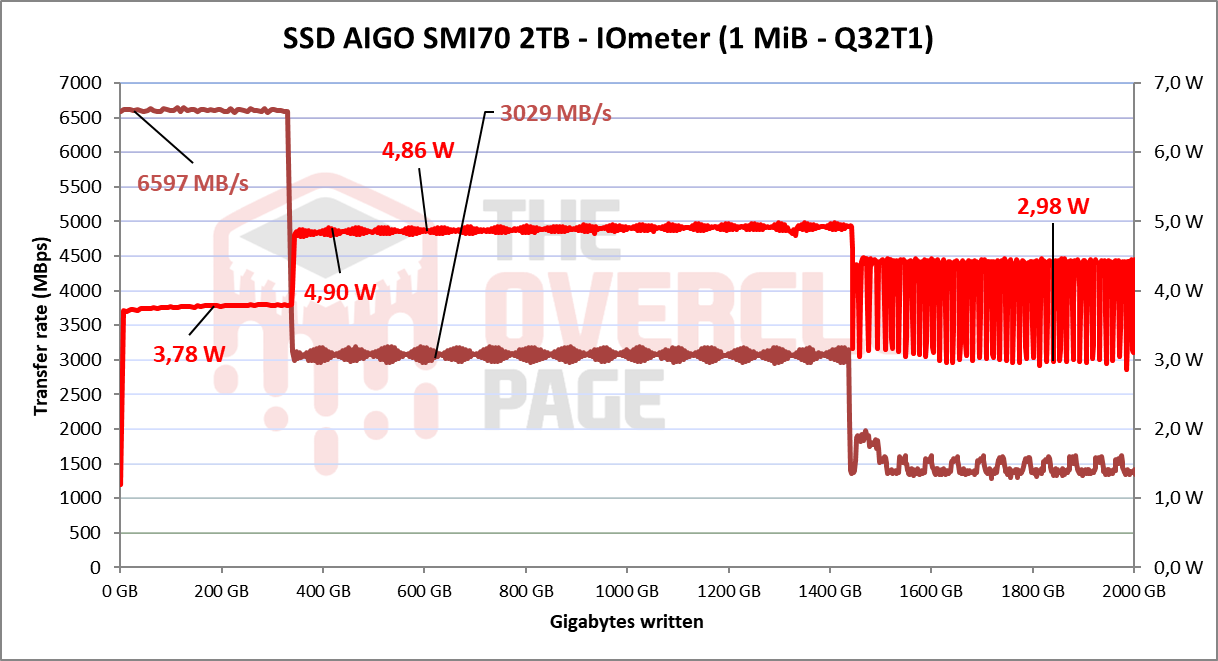
Through IOmeter, we can estimate the size of the SLC cache of this SSD, as manufacturers often do not provide this information. Based on the tests we conducted, it was observed that it has a pSLC cache volume that appears to be dynamic and extensive, approximately 337GB. It managed to maintain an average speed of around 6607MB/s until the end of the buffer, which is quite impressive considering that this is a PCIe 4.0 SSD with a capacity of 2TB and 16 TLC dies.
After writing 337GB, it begins writing to its NANDs in native TLC mode, operating at an average speed of 3074 MB/s, which is quite high. It maintains these speeds for a considerable amount of time, writing over 1100GB at speeds exceeding 3 GB/s, which is remarkable.
Right after exhausting its SLC cache space, it begins the folding process since it has allocated all its capacity to work as pSLC. So now we see the true “Achilles’ heel” of SSDs. However, its sustained speed was quite decent, averaging 1457 MB/s, which is well above the sustained speed of many other SSDs out there.


We also conducted a test to see how long the SSD would take to recover part of its buffer, during our test battery, which lasts from 30 seconds to 2 hours in idle, using TRIM and garbage collection versus not using TRIM/GC. When testing without using TRIM/GC, we observed that it failed to recover any of its SLC cache, which is a downside indeed. However, this doesn’t necessarily qualify it as having poor SLC cache design; it simply means that in this unrealistic scenario, it couldn’t take advantage of this opportunity.


But when tested with TRIM/GC activated, it’s able to recover its full volume within just a few seconds.
FILE COPY TEST
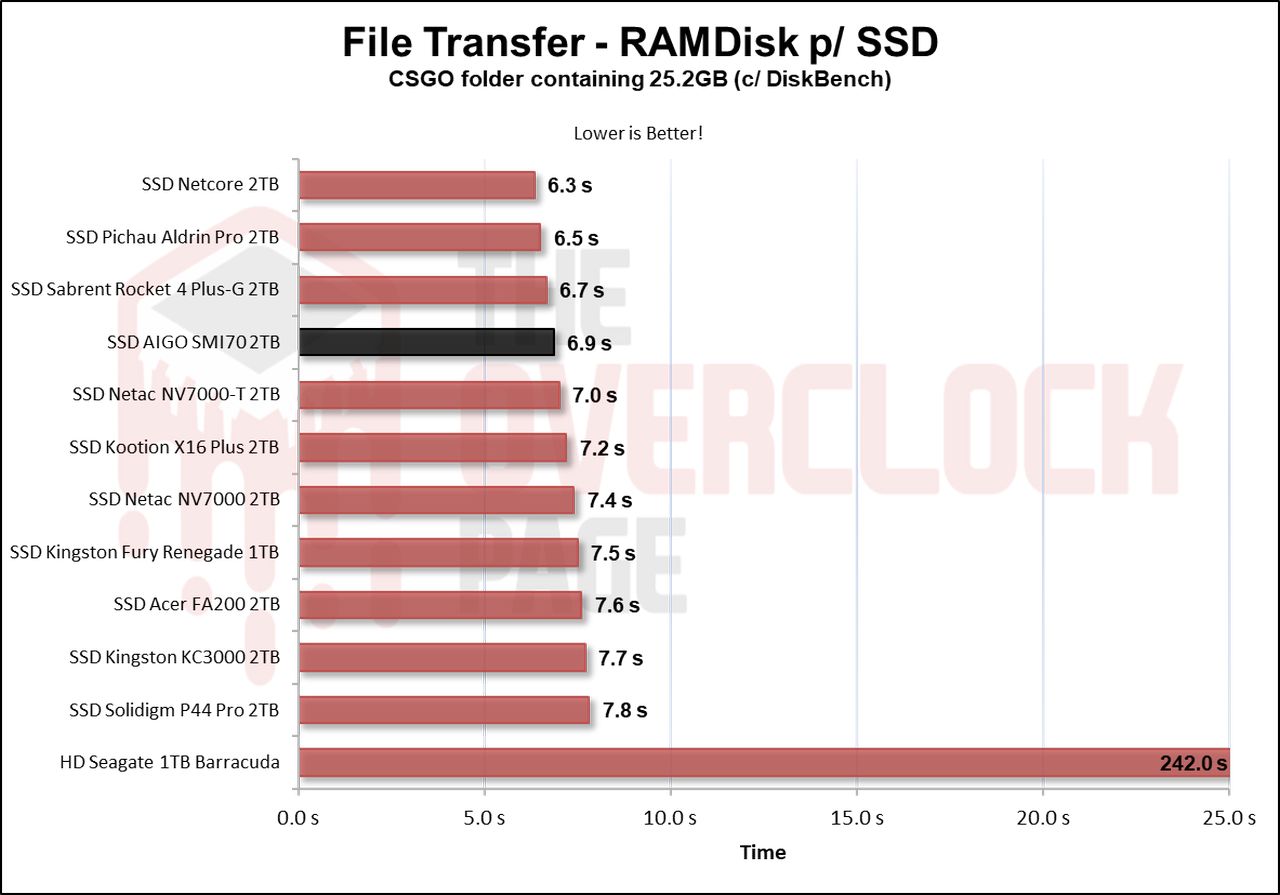
In this test, we copied ISO files and the CSGO directory from a RAM Disk to the SSD to see how it performs. We used the Windows 10 21H1 ISO, which is 6.25GB in size (1 file), along with the CSGO installation folder, which is 25.2GB.
When using the Windows 10 ISO image, we observe that in these casual scenarios, it does indeed offer good performance and ends up performing almost equally to the NV7000-T, slightly ahead due to its higher sustained speed.
The same is true when using larger files, thanks to its immense SLC cache volume.
TEMPERATURE STRESS TEST
In this part of the analysis, we’ll observe the temperature of the SSD during a stress test, where the SSD receives files continuously, to determine if there was any thermal throttling with its internal components that could lead to bottlenecking or performance loss.
As seen above, this SSD has a default thermal throttling limit of 86ºC to 93°C, which is a decent value. Through the sensors, we observe that it exceeds 92ºC, causing the controller to enter one of the Thermal Throttling states where its speeds drop from 3000 MB/s to around 1400-1500 MB/s.
In this video above, we can see its temperatures using a thermal camera, and we can conclude that indeed it heats up quite a bit like the MAP1602, although the maximum temperature recorded by the camera was just over 70ºC. On the controller die, it got quite hot, but this thin adhesive helped a bit dissipating heat.
POWER CONSUMPTION AND EFFICIENCY
SSDs, like many other components in our system, have a certain level of power consumption. The most efficient ones can perform tasks quickly with relatively low power consumption, allowing them to transition back to idle power states where they tend to consume less energy.
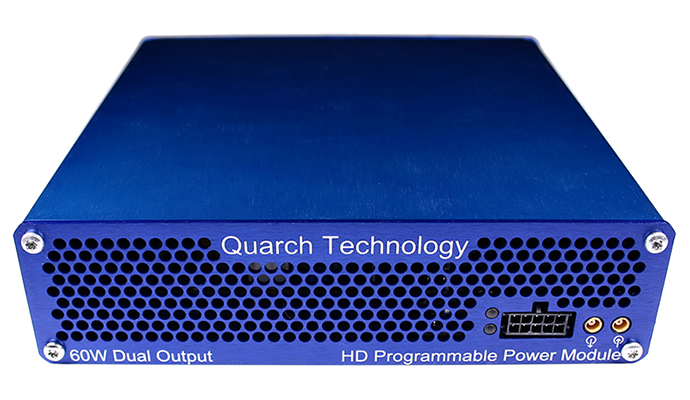
In this part of the analysis, we will use the Quarch Programmable Power Module provided by Quarch Solutions to conduct these tests and assess how efficient the SSD is. In this methodology, we will perform three tests: the maximum power consumption of the SSD, an average in practical and casual scenarios, and during idle.
This test suite, especially the efficiency and idle tests, is crucial for users planning to use drives in laptops because SSDs spend the majority of their time in low-power states (Idle). Therefore, this information is essential for optimizing battery life.
Surprisingly, it manages to outperform its competitors, even though SSDs with MAP1602 were already considered very efficient in terms of power consumption. This result was achieved due to a higher bandwidth in the benchmark and a slightly lower consumption, which ultimately led to this incredible outcome.
Regarding its maximum power consumption, it’s possible to observe that it achieves a slightly lower result than 5W, which is lower than the Solidgm P44 Pro, but still a bit higher than SSDs with MAP1602.
Now, during this benchmark, we can see that it really stays about 70mW to 470mW below the SSDs with MAP1602, and coupled with the fact that it had a slightly higher bandwidth, it brings that unexpected result we saw earlier. This is surprising, as the expectation was for a similar or slightly lower result, due to this controller using the Cortex-R8, which, although “faster” than the traditional Cortex-R5, bring a negative point which is their higher energy consumption compared to the R5.
Finally, and most importantly, the Idle test, which is the scenario where the vast majority of SSDs are in everyday use. Here, it surprises again with the lowest consumption among these Gen4 SSDs. Interestingly, it is in Power State 2, which is around 600mW. It hasn’t even reached Idle mode yet, proving that it is indeed very efficient.
Conclusion
This new Silicon Motion controller has proven to be worthy of recommendation alongside these NAND Flash chips. Not only does it deliver good performance, but it also proves to be extremely energy efficient. Interestingly, it managed to surpass expectations by outperforming the MAP1602, which was unexpected considering it’s a controller with Cortex-R8 cores on the 12nm TSMC process.
ADVANTAGES
- Good sequential speeds
- The best random performance (read) I’ve tested so far
- Good latency results, especially its read speed which surpassed all others I’ve tested
- Excellent practical performance for casual scenarios and even professional environments like video editing
- No variants with different components
- Excellent internal construction, with great controller and NAND Flash
- Immense pSLC Cache volume
- High sustained write speed post SLC Cache
- Durability well above average
- 5-year warranty
- The highest energy efficiency I’ve seen so far
- Low idle power consumption
DISADVANTAGES
- Thermal throttling occurs
- SLC Cache takes time to recover (though not significantly in practice)
- Lacks management software
- No encryption feature
- Price not disclosed


