Review: Teamgroup NV10000 1TB SSD, an efficient and fast Gen5 drive!
 by Giancarlo C. Dalmedico "NoMS" September 30, 2026 · Reviews / SSDs e armazenamento
Today, we are testing the Teamgroup NV10000 NVMe SSD, which was sent to us by Teamgroup for review. Thanks, Teamgroup 🙂
It comes in an M.2 form factor with a 128Gbps bus, meaning it features 4 PCIe 5.0 lanes, the NVMe 2.0 protocol, and capacities ranging from 1TB up to 4TB. Its price generally falls around R$1,800 for the 1TB unit and R$2,800 for the 2TB model.
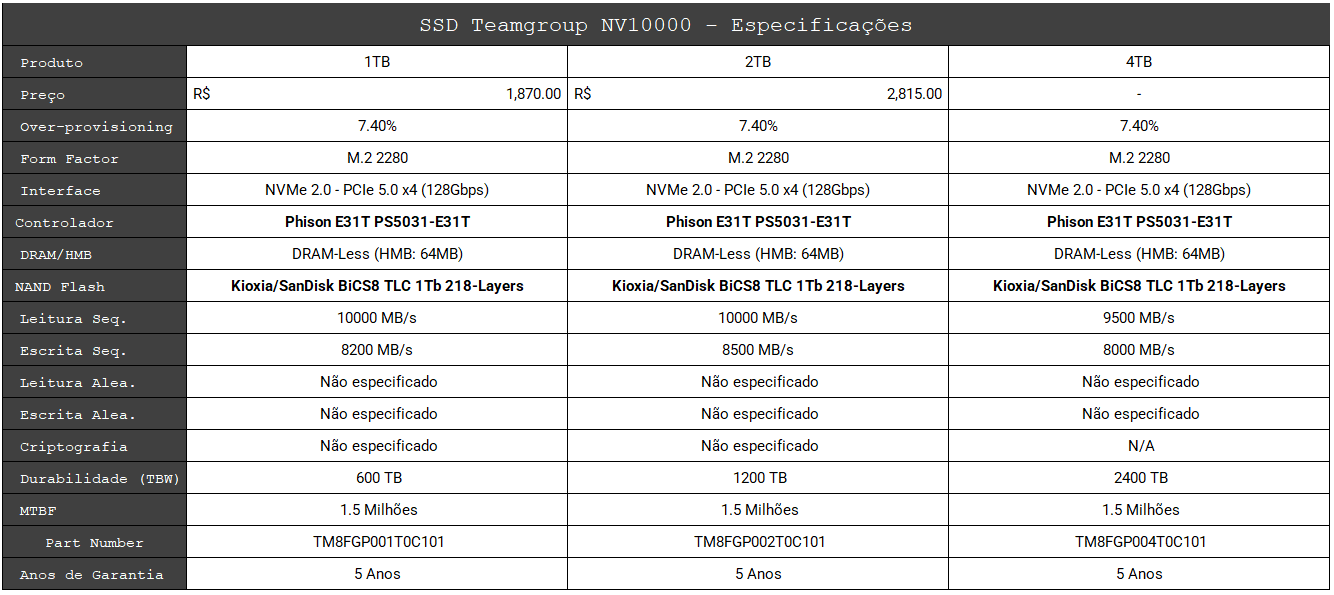
NV10000 Specs
Below is some more detailed information about the SSD we will be testing (the 1TB unit):
SSD Software
Teamgroup SSDs come with management software that allows for monitoring, SMART data retrieval, etc.

Unboxing
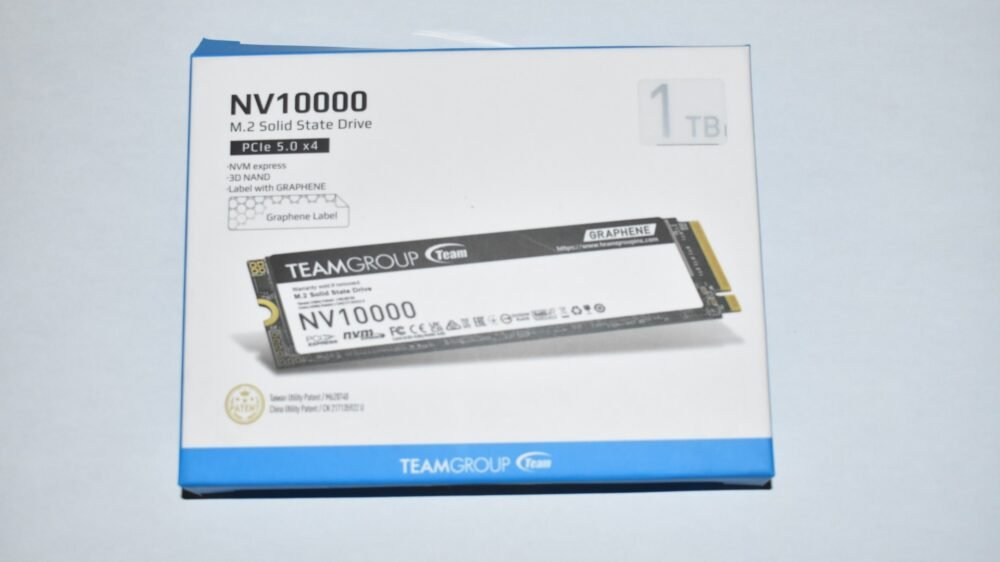
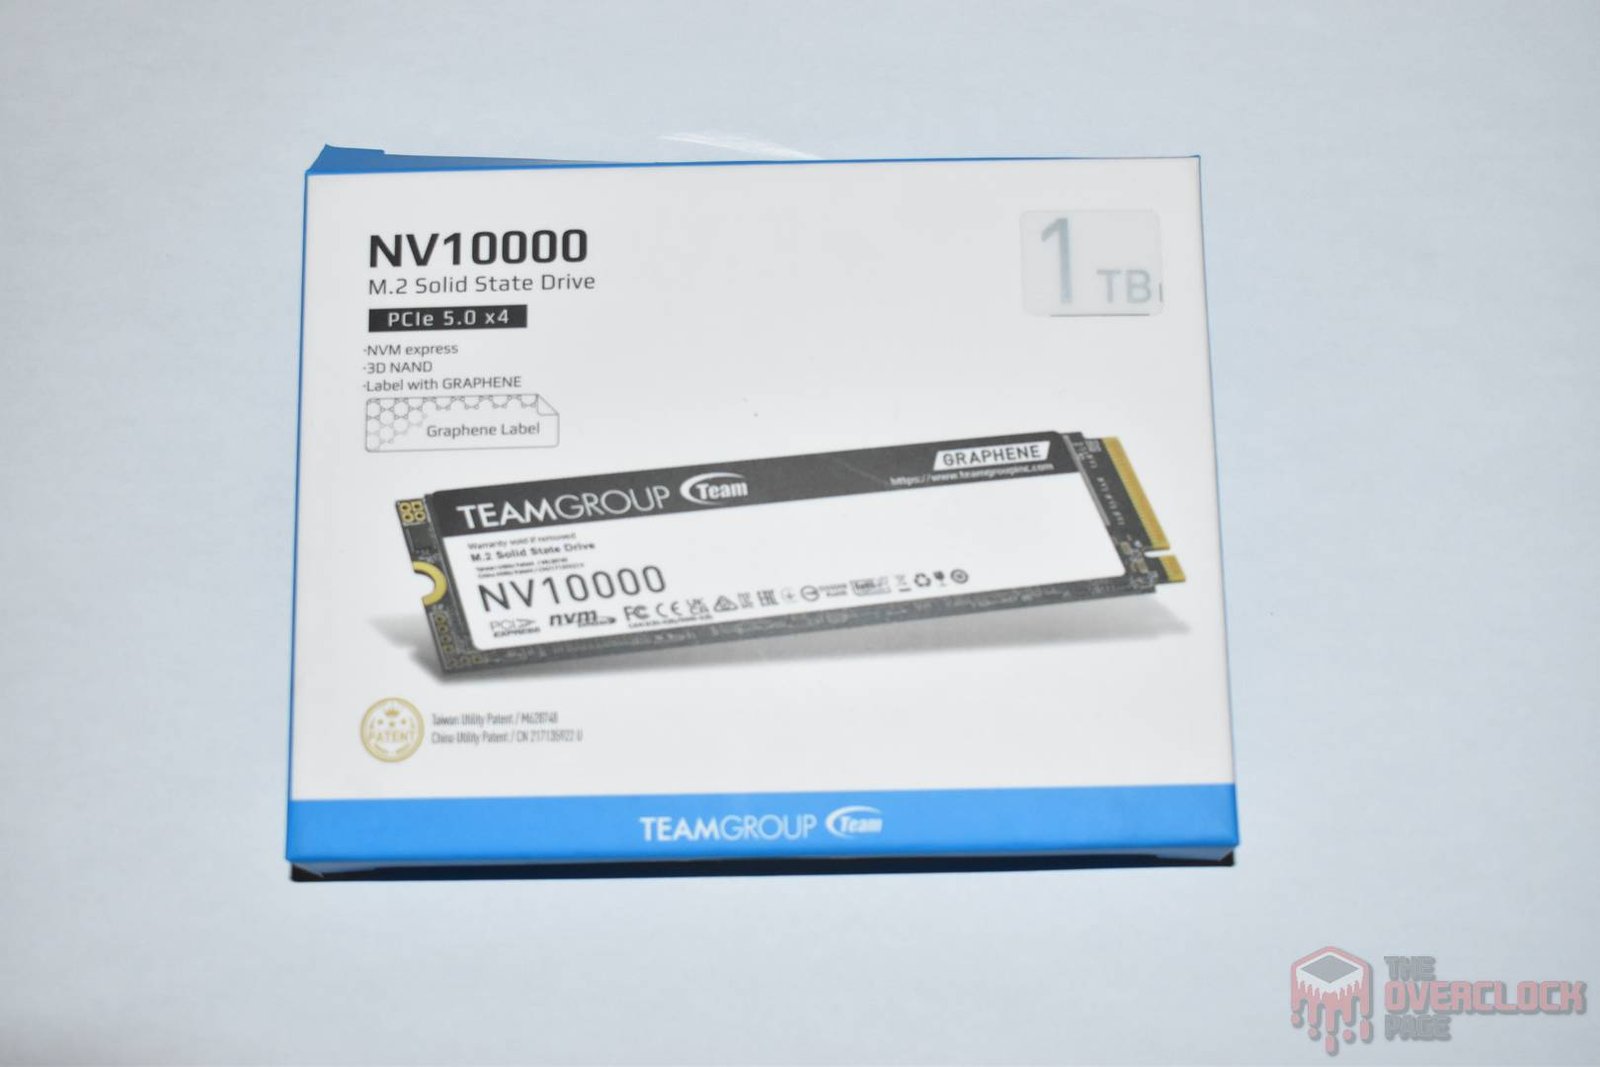
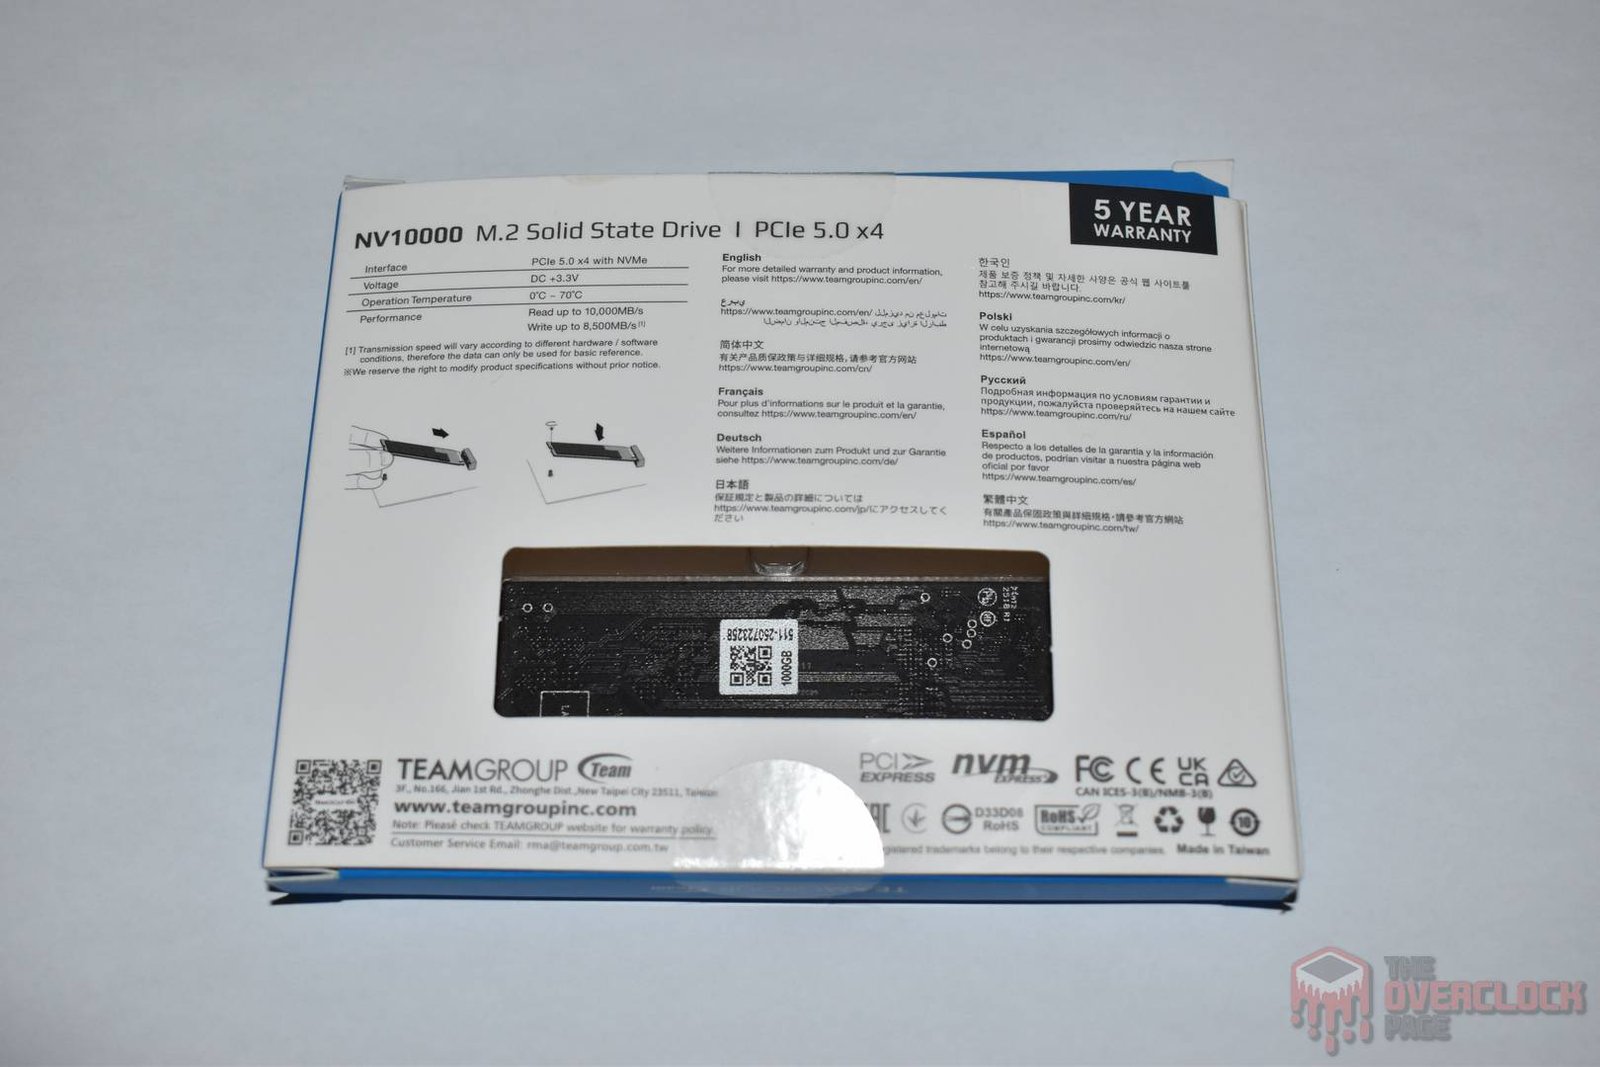
The SSD comes in a white box highlighting the brand, model, and capacity, featuring a plastic window on the back that makes the drive and its label visible. Upon opening it, we find the SSD inside a protective plastic blister, and no accessories are included.
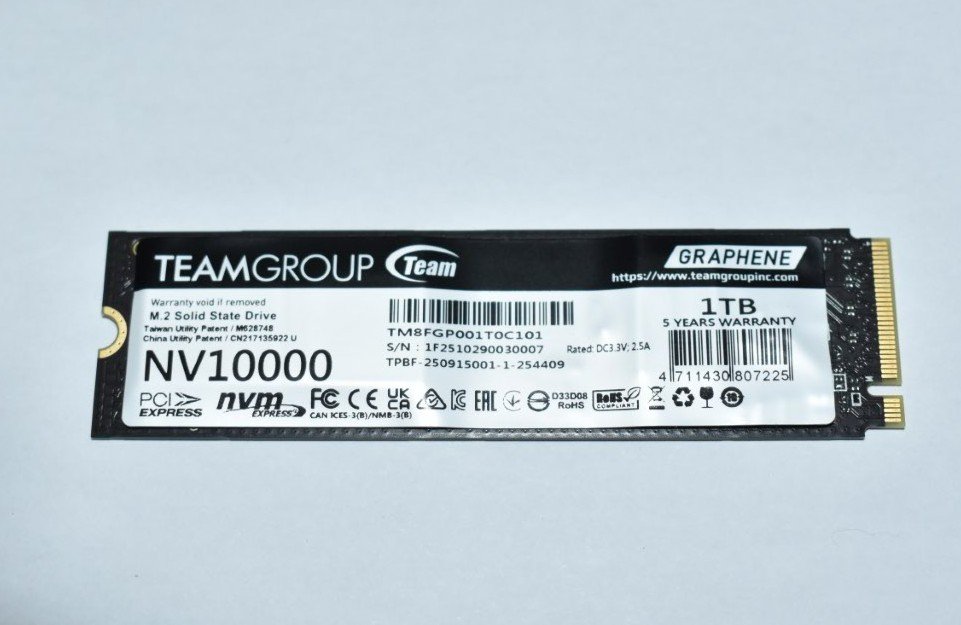
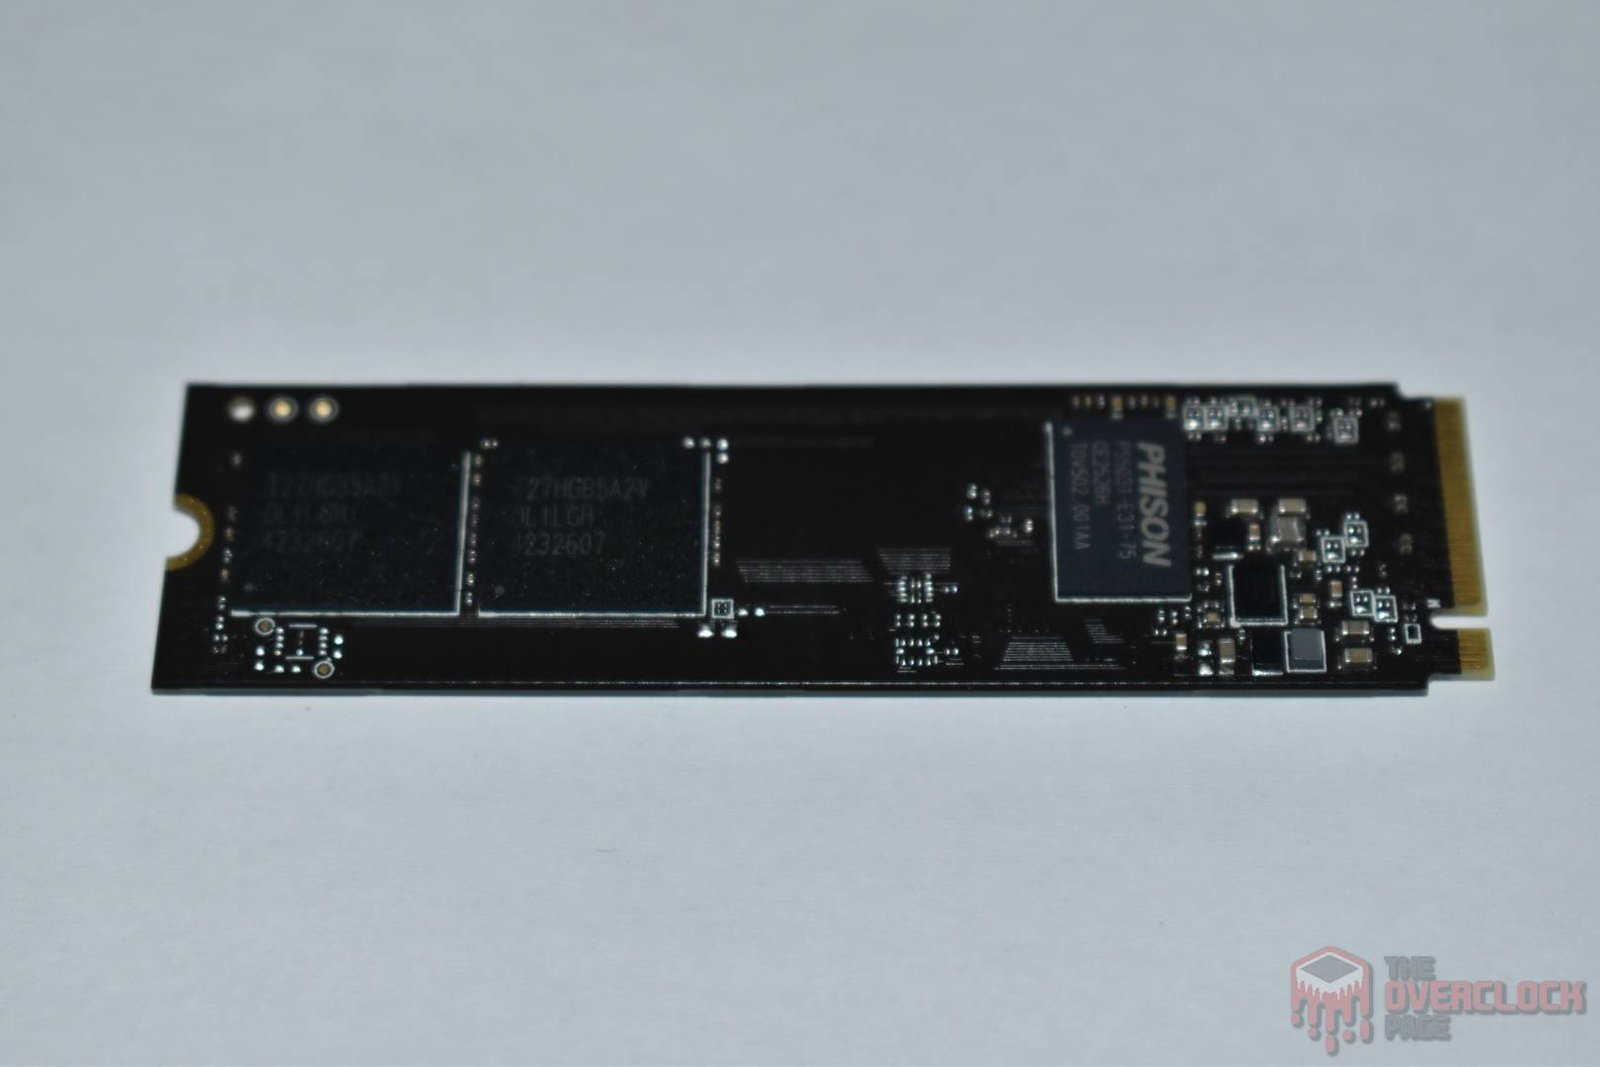
This model uses a single-sided design with ICs only on the front side of the PCB, facilitating SSD cooling, and it does not come with a heatsink. We will see later how it performs in temperature tests.
On its front PCB, we find three main chips, two NAND flashes, a controller, some load switches, and MOSFETs to provide power.
Controller
The SSD controller is responsible for all data management, over-provisioning, and garbage collection, among other tasks that occur in the background. And, of course, this is what ensures the SSD achieves good performance.
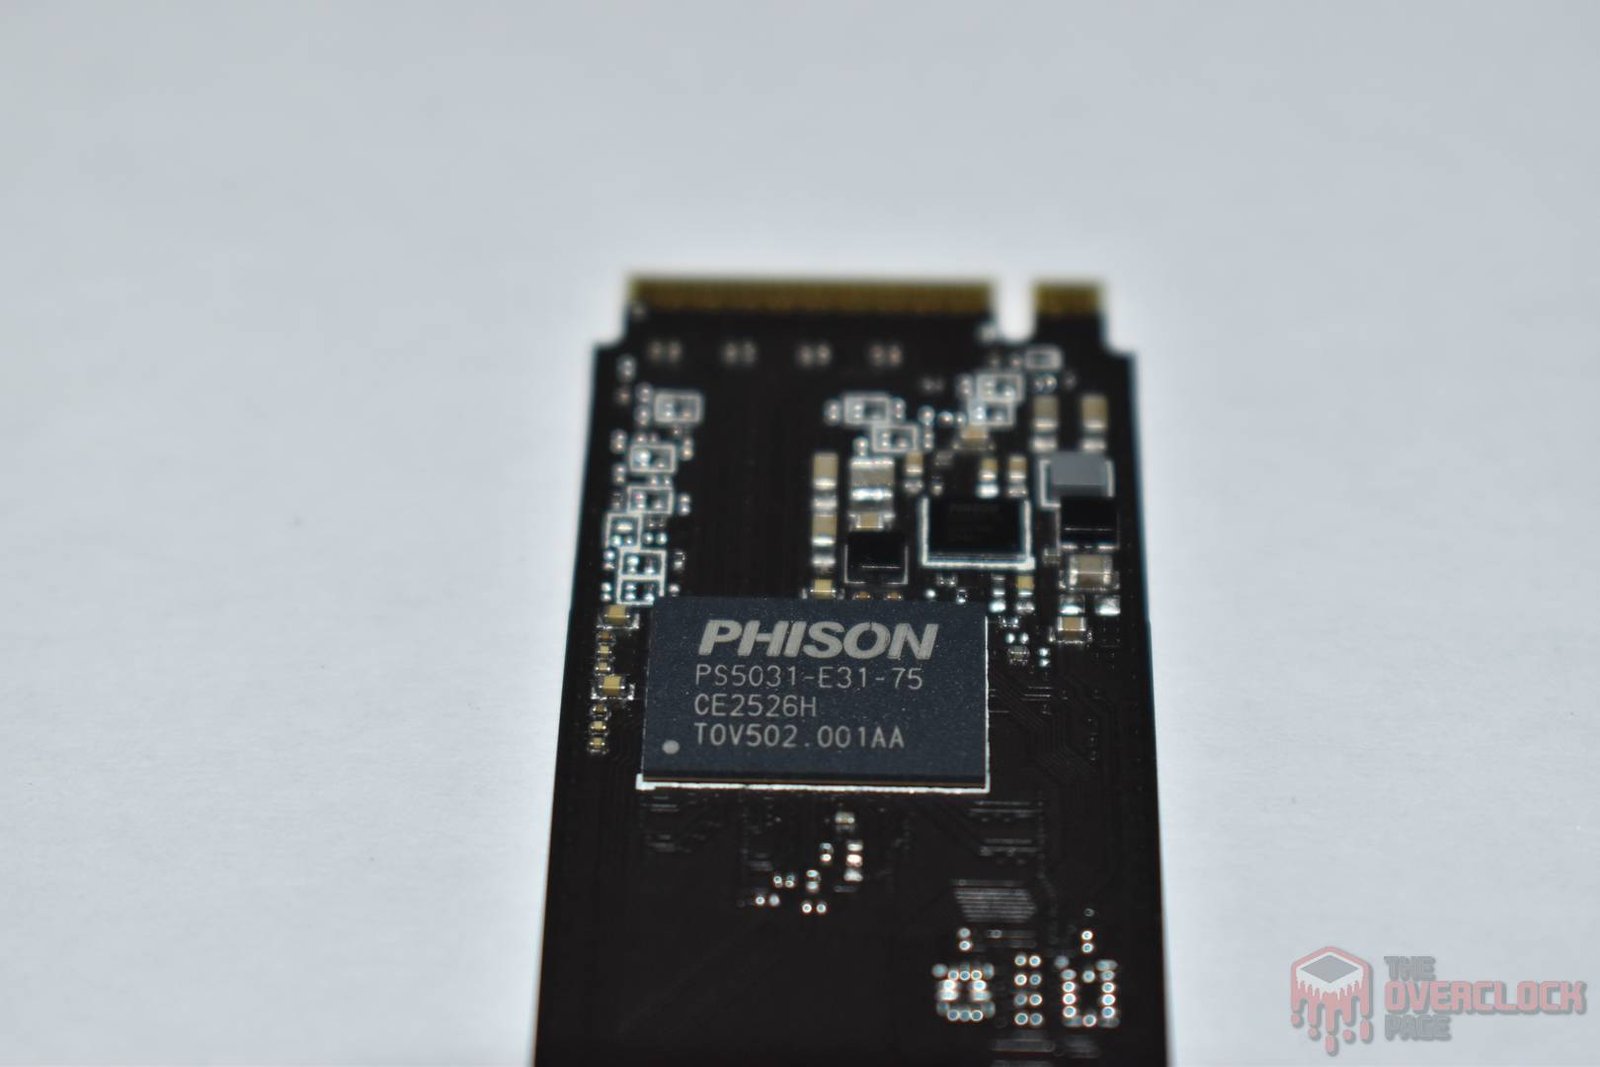
This SSD uses a controller from Phison, model PS5031-E31-75, which belongs to the PS5031-E31T family. It features a single-CPU architecture based on a 32-bit ARM Cortex®-R5 microcontroller, manufactured by TSMC using a 7nm process. It offers a PCI Express 5.0 x4 interface with NVMe 2.0 protocol support, making it a solution aimed at the mainstream Gen5 SSD market while also focusing on energy efficiency.
This controller features a DRAM-less architecture, meaning it lacks dedicated DRAM memory to store its mapping tables, instead utilizing technologies like HMB (Host Memory Buffer) to leverage a small portion of the system’s RAM for this purpose.
Additionally, the controller provides four communication channels with the NAND flash, supporting up to 16 Chip Enables (CE) and transfer rates of up to 3600 MT/s between the controller and the memory. It supports both 3D TLC and QLC memories, with a theoretical maximum capacity of up to 8 TB. In this specific SSD, as we will see later, its NAND flash operates at 3600 MT/s.
DRAM Cache or H.M.B.
Every high-end SSD aiming for consistent high performance requires a buffer to store its mapping tables (Flash Translation Layer or Look-up table). This allows it to achieve better random performance and be more responsive.
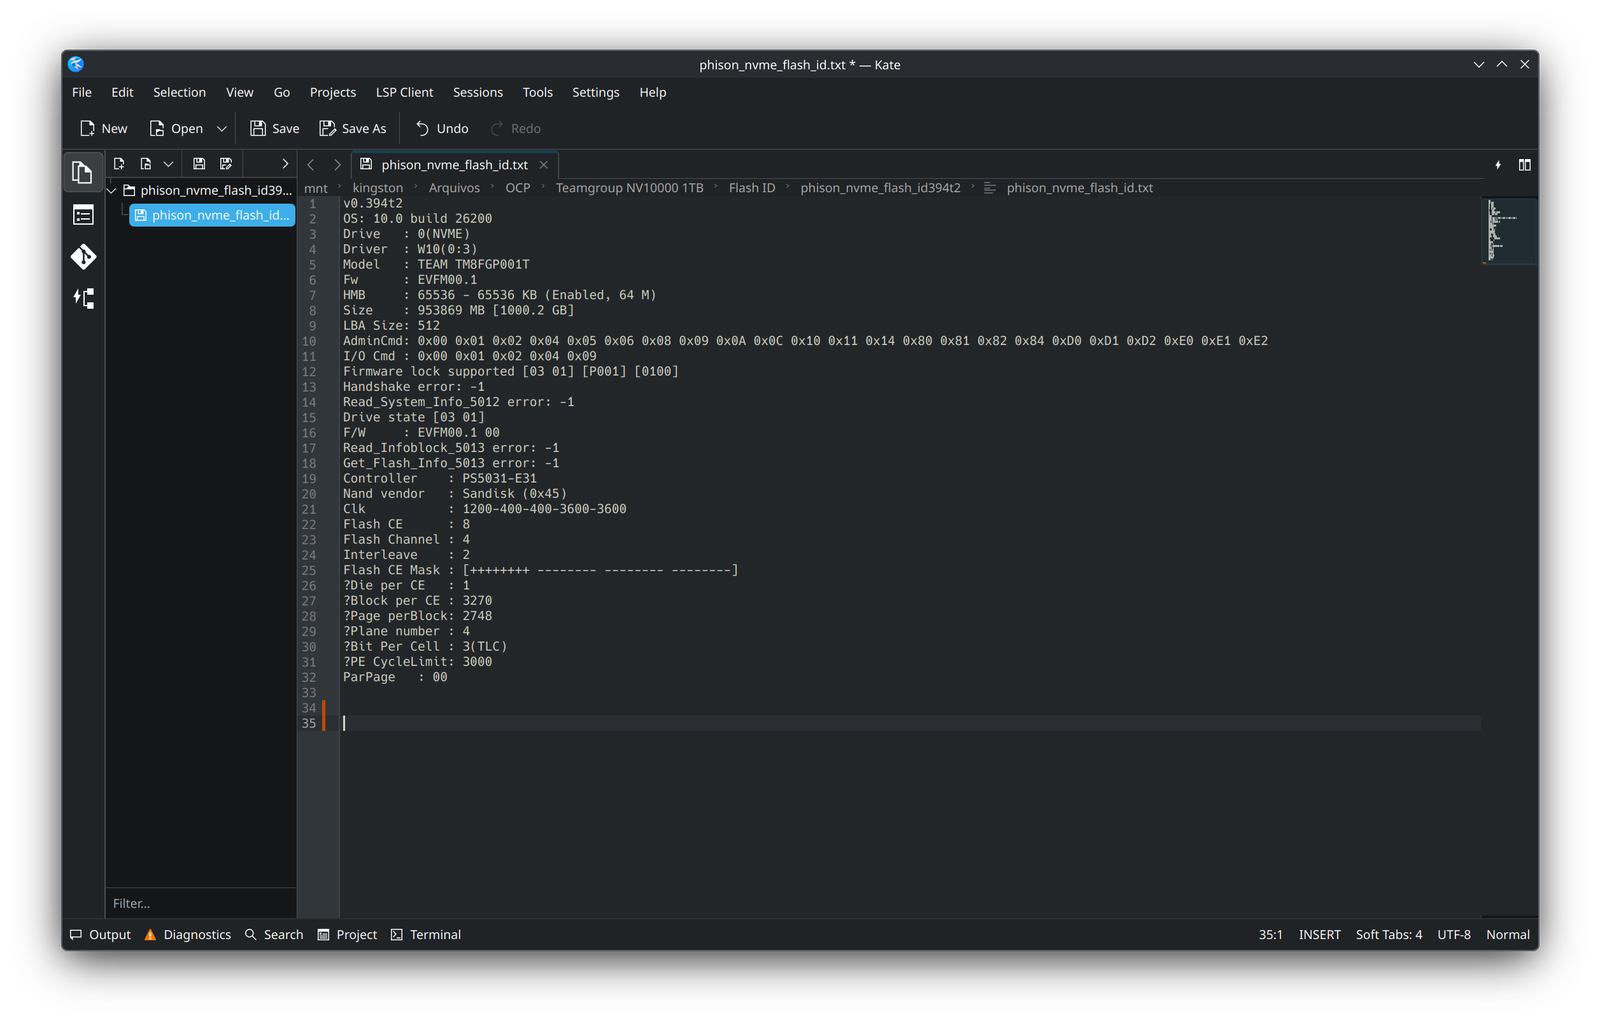
As we previously mentioned, since it is a DRAM-less controller, it does not offer DRAM cache support, so in order to store the metadata tables, it allocates 64 MiB of system RAM to speed up table access.
NAND Flash
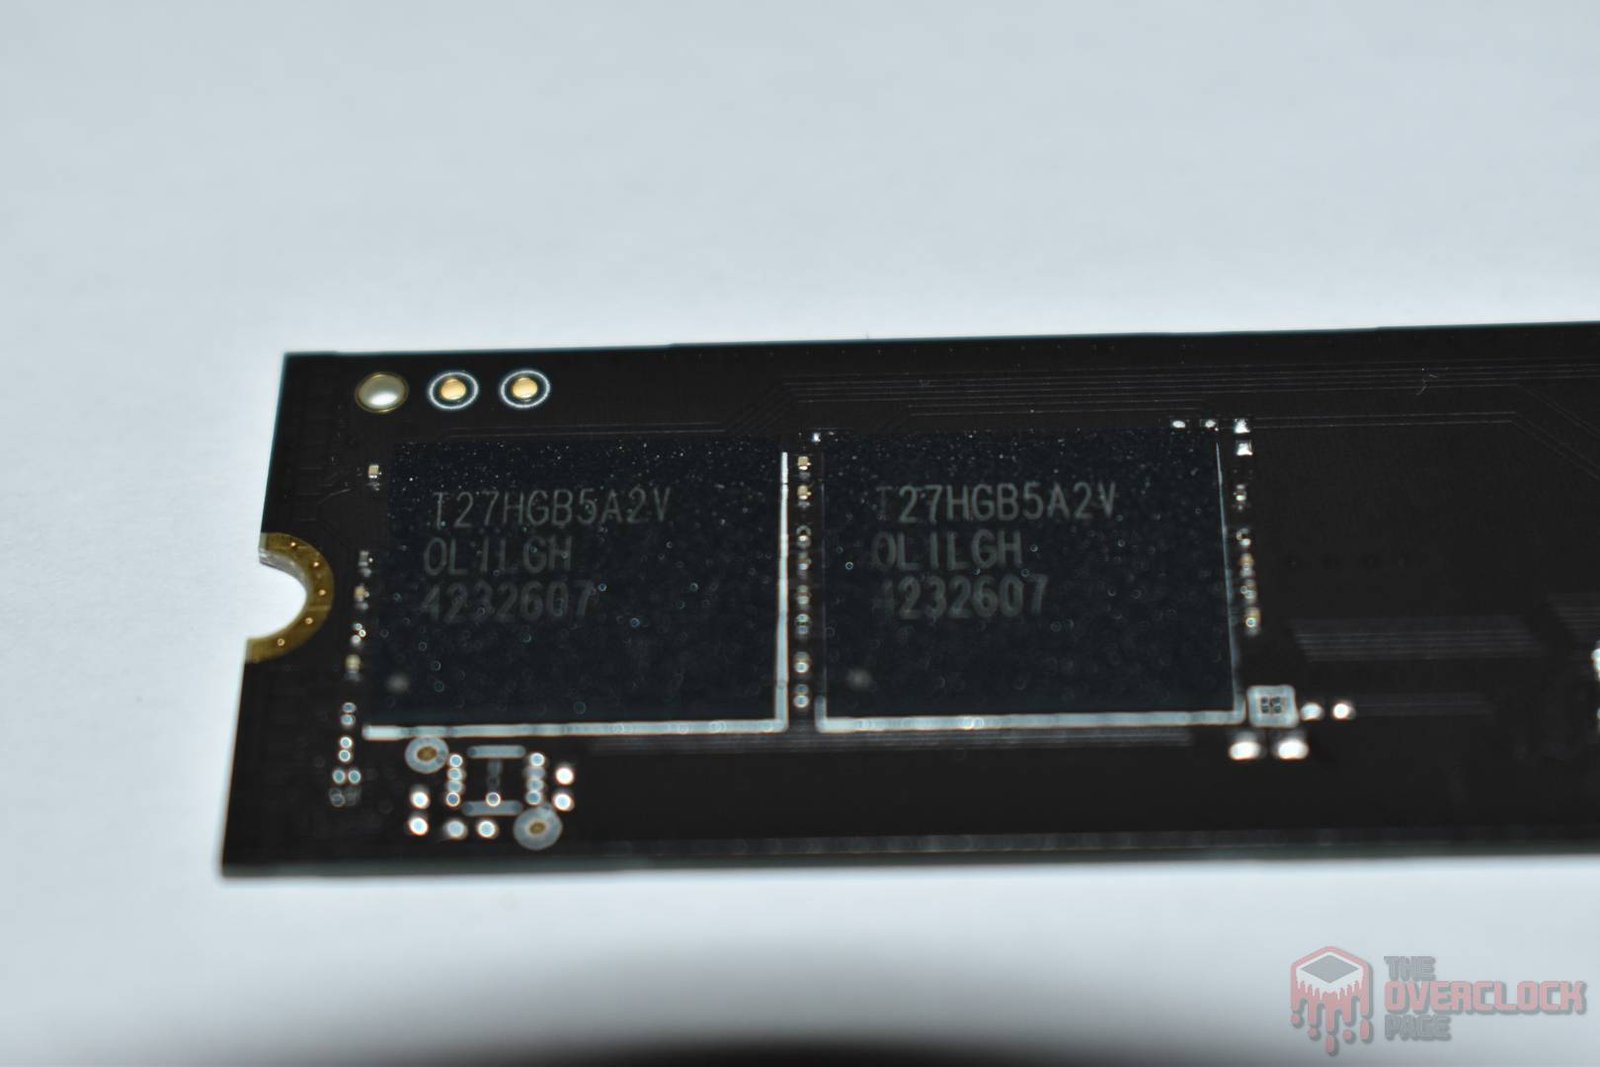
Regarding its storage ICs, the 1TB SSD features two Kioxia BiCS8 3D TLC NAND Flash chips, which in this case use 1Tb (128GB) density dies. These memories utilize a 218-layer structure (Word Lines) and a total of approximately 241 gates per string, resulting in an array efficiency of about 90.5%, where 218 of those layers are effectively used for data storage.
Each NAND Flash chip contains four 1Tb dies, equivalent to 128GB per die, totaling 512GB per package. Since the SSD includes two of these chips, there is a total of eight dies and 1TB of raw capacity.
These NAND Flashes use Kioxia’s BiCS8 architecture, which introduces CBA (CMOS directly Bonded to Array) technology, in which the CMOS circuit responsible for cell control is produced separately from the memory array and later joined to it. This approach allows for increased density, reduced die area, and improved performance as well as energy efficiency.
The memories also offer a high-speed interface of up to 3600 MT/s, which is exactly the speed used in BiCS8 implementations alongside the Phison E31T controller, enabling the four-channel controller to reach significantly high transfer rates.
Each die features a 4-plane architecture, allowing different operations to be performed in parallel within the same die and increasing the level of parallelism available to the controller. This characteristic, combined with the 1Tb dies, the 3600 MT/s interface, and the CBA architecture, is one of the main factors that allow SSDs using the Phison E31T controller to exceed 10 GB/s even while employing only four NAND channels.
PMIC (Power Delivery)

Just like any electronic component that performs a task, SSDs also have power consumption levels that can range from just a few milliwatts to nearly 10W, approaching the limit of some connectors or slots. The circuit responsible for all power management is the PMIC, which stands for Power Management IC, a chip responsible for providing power to the other components.
It was not possible to identify the load switch used.
SSD Power States
As we always mention in our power consumption reviews, in this section, we will take a closer look at the power states of this SSD.
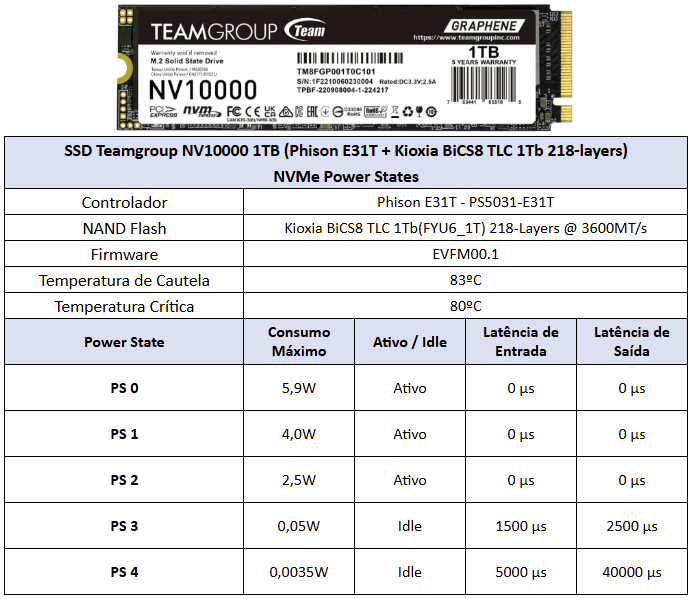
This SSD features five primary power states, with three active and two in Idle. The active states feature low entry and exit latencies and a maximum ‘consumption’ of 5.9W, which we will see later was actually lower in practice, while the other idle power states have latencies above 5ms and a maximum consumption of 0.05W.
INTERESTING FACTS ABOUT THE TEAMGROUP NV10000 1TB SSD
Just like integrated circuits on a memory stick vary, the same happens with SSDs, where there are instances of component changes such as controllers and NAND flashes.
As of this review, we haven’t been able to identify other variants of this SSD, but we will keep an eye out for any differences that may appear in the future.
TEST BENCH
– Operating System: Windows 11 Pro 64-bit (Build: 25H2)
– Processor: Intel Core i7 13700K (5.7GHz all core), with E-cores and Hyper-threading disabled
– RAM Memory: 2x 32 GB KLEVV CRAS V DDR5-6400 CL-32
– Motherboard: MSI MAG Z790 Tomahawk Max Wifi (BIOS Ver.: BIOS 7E25vA8)
– Graphics Card: RTX 4070 Ti Super Colorful (Drivers: 572.83)
– Storage (OS): Solidigm P44 Pro 2TB SSD (Firmware: 001C)
– Tested SSD: Teamgroup NV10000 SSD
– Intel Z790 Chipset Driver Version: 10.1.19376.8374
– Windows: Indexing disabled to avoid affecting test results
– Windows: Windows Updates disabled to avoid affecting test results
– Windows: Most background applications disabled from running
– Windows Boot Test: Clean image with only drivers and all updates
– pSLC Cache Test: The SSD is cooled by fans to prevent thermal throttling, which could interfere with the results
– Windows: Anti-Virus disabled to reduce variance per run
– Tested SSDs: Used as a secondary drive with 0% capacity used, and other tests at 50% capacity to represent a realistic scenario
– Quarch PPM QTL1999, Power Consumption Test: Performed with three parameters, in idle where the drive is left as secondary, followed by a one-hour write test to calculate the average.
- The tests were conducted by Gabriel Ferraz, special thanks go to him, and here is the link to his YouTube channel: https://www.youtube.com/@gabrielferrazdetetivehardware
CRYSTALDISKMARK
We performed sequential and random synthetic tests with the following configurations:
Sequential: 2x 1 GiB (1 MiB Blocks) 8 Queues, 1 Thread
Random: 2x 1 GiB (4 KiB Blocks) 1 Queue, 1/2/4/8/16 Threads
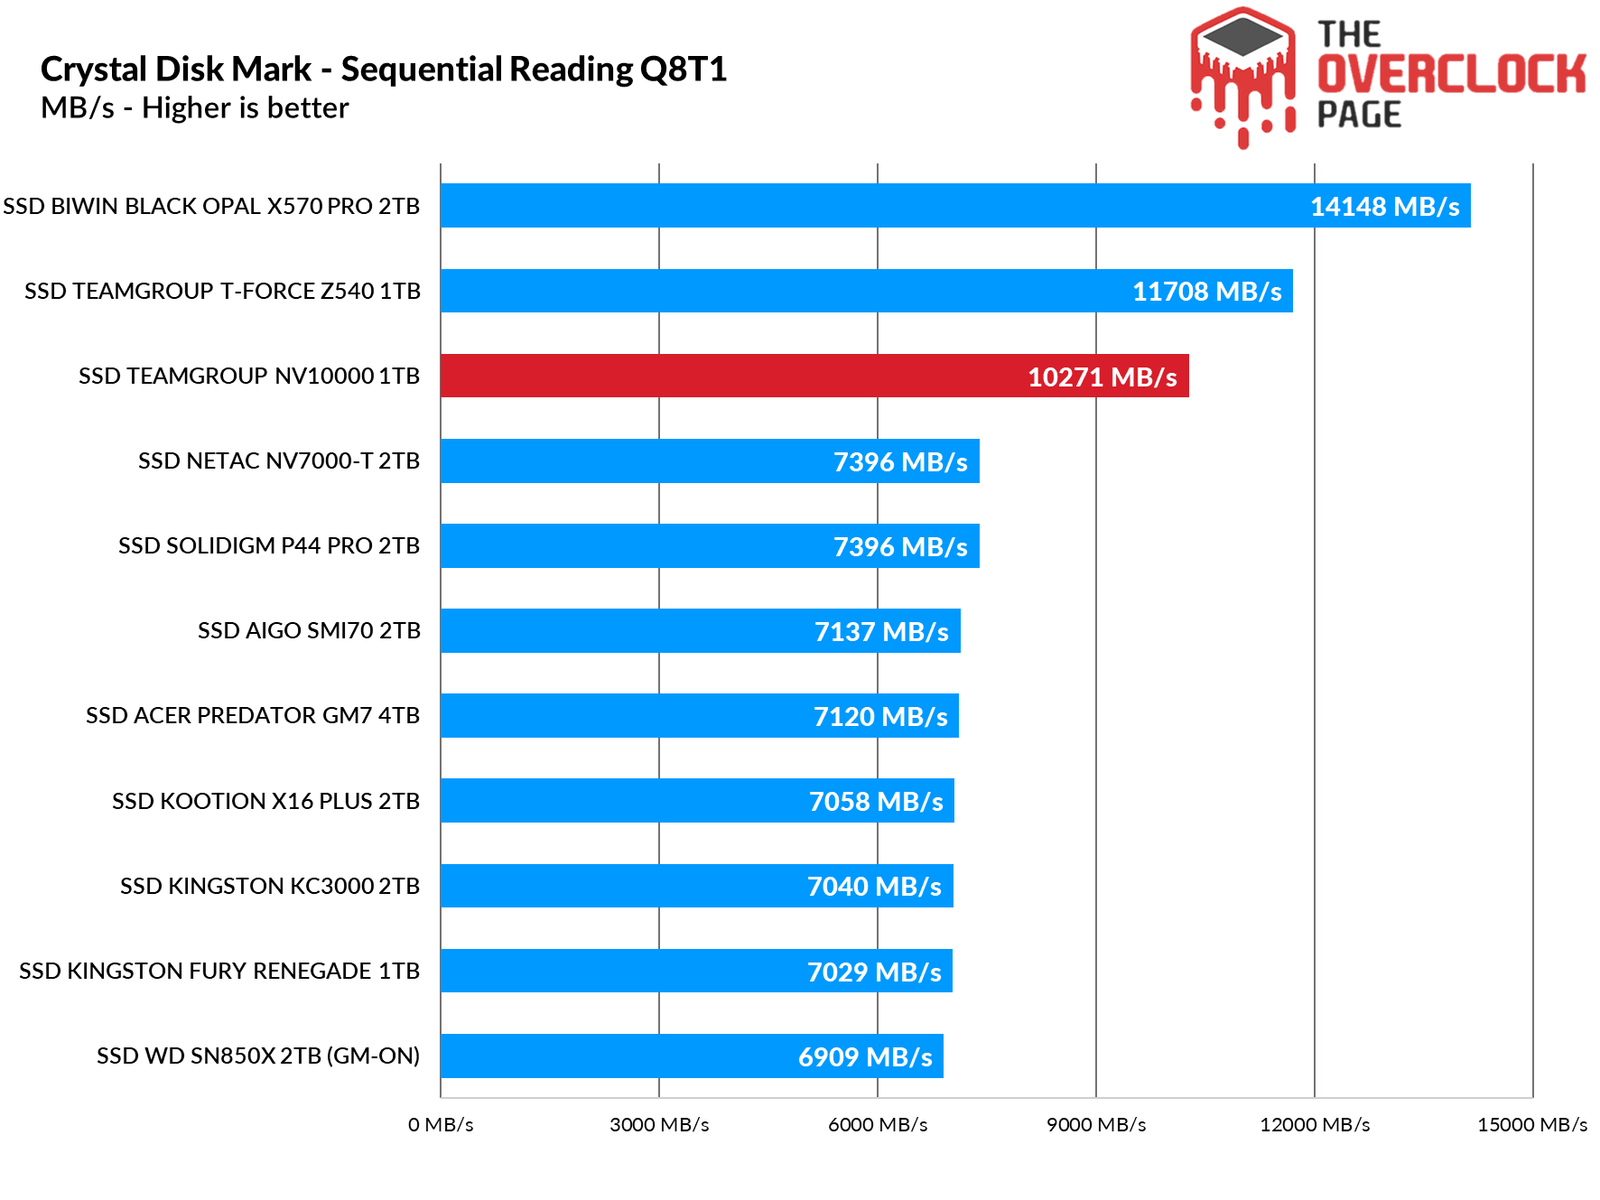
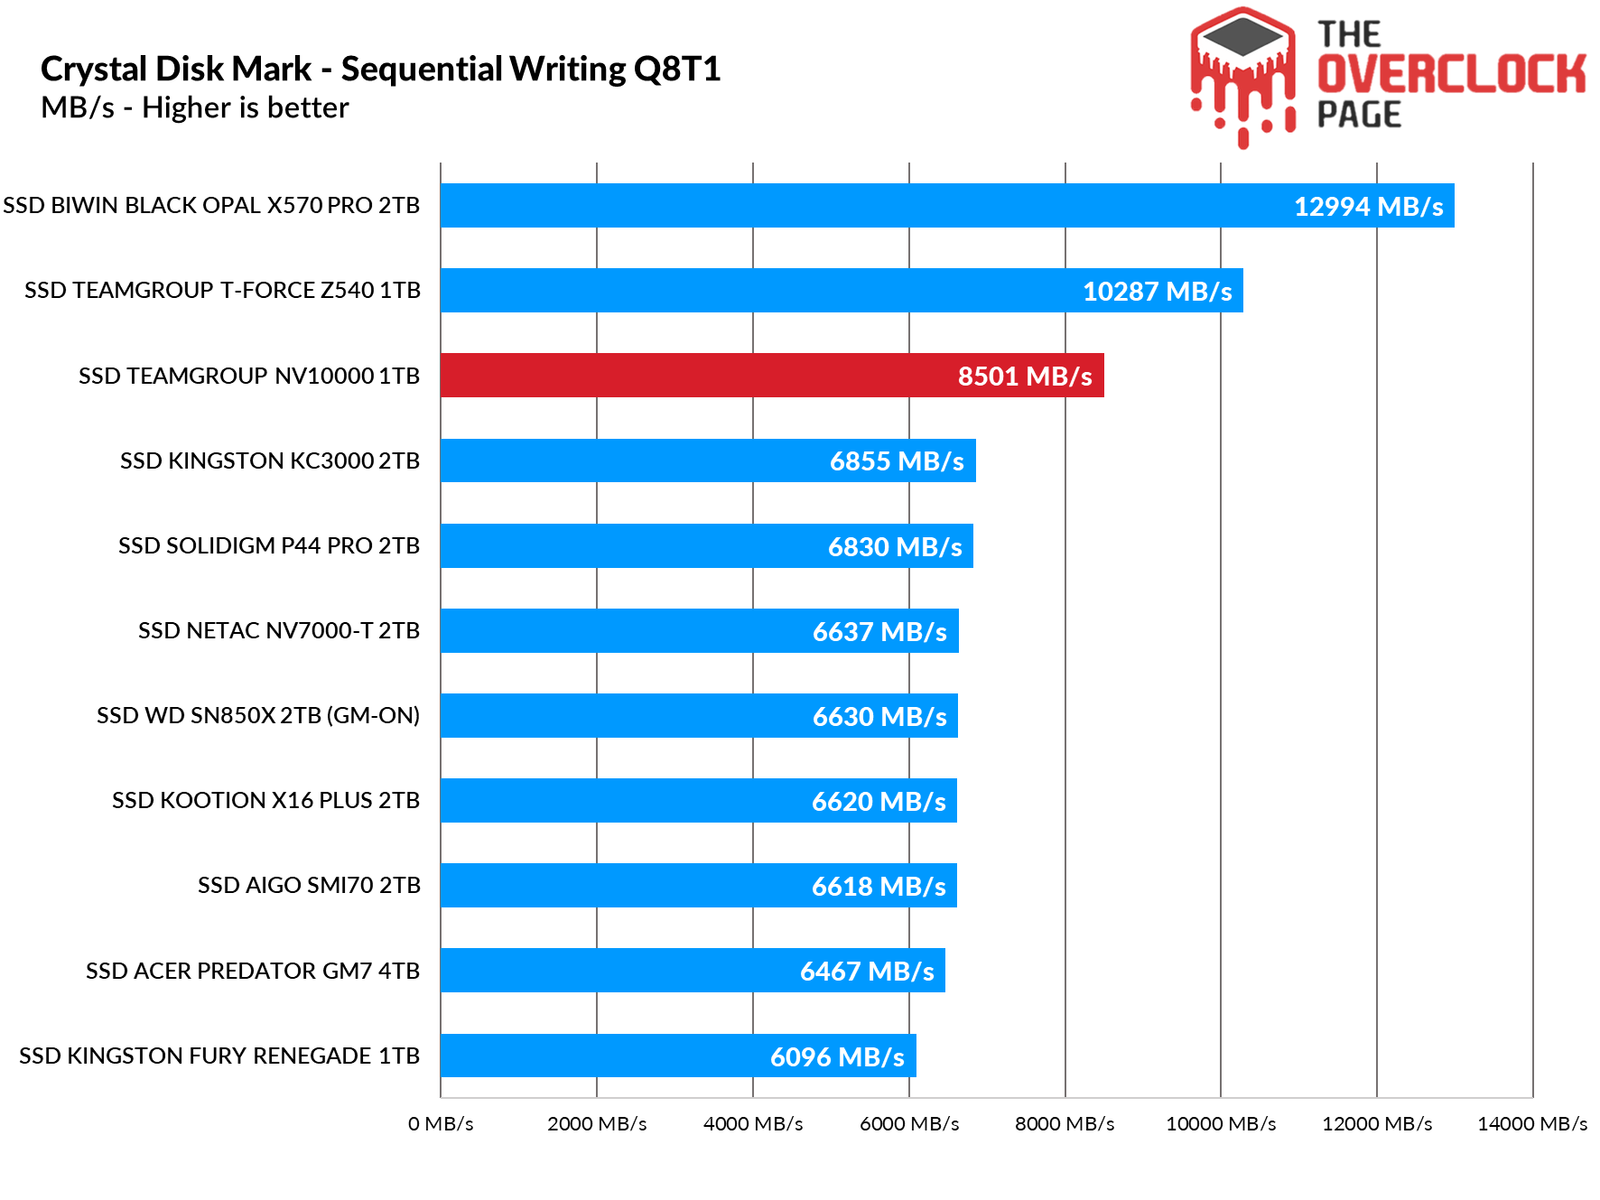
When testing its sequential speeds, it delivers on what it promises, falling just slightly behind the Z540 we tested previously.
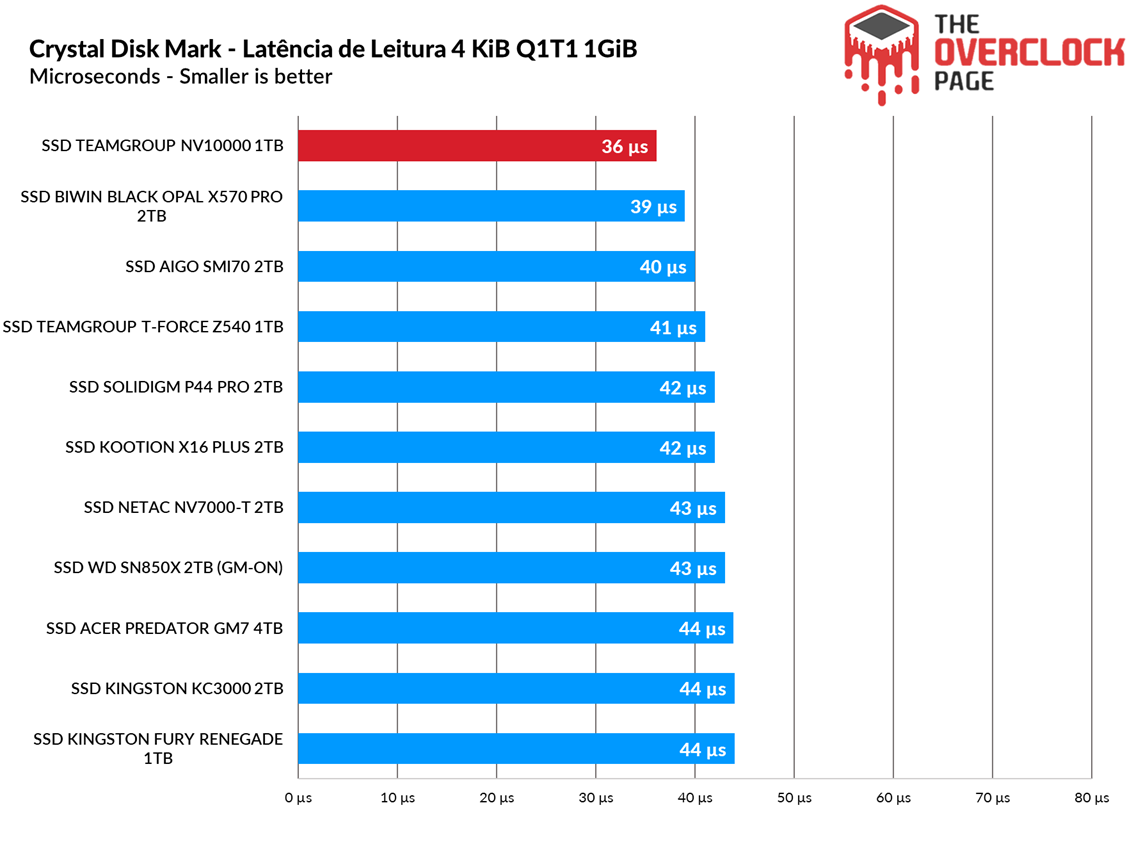
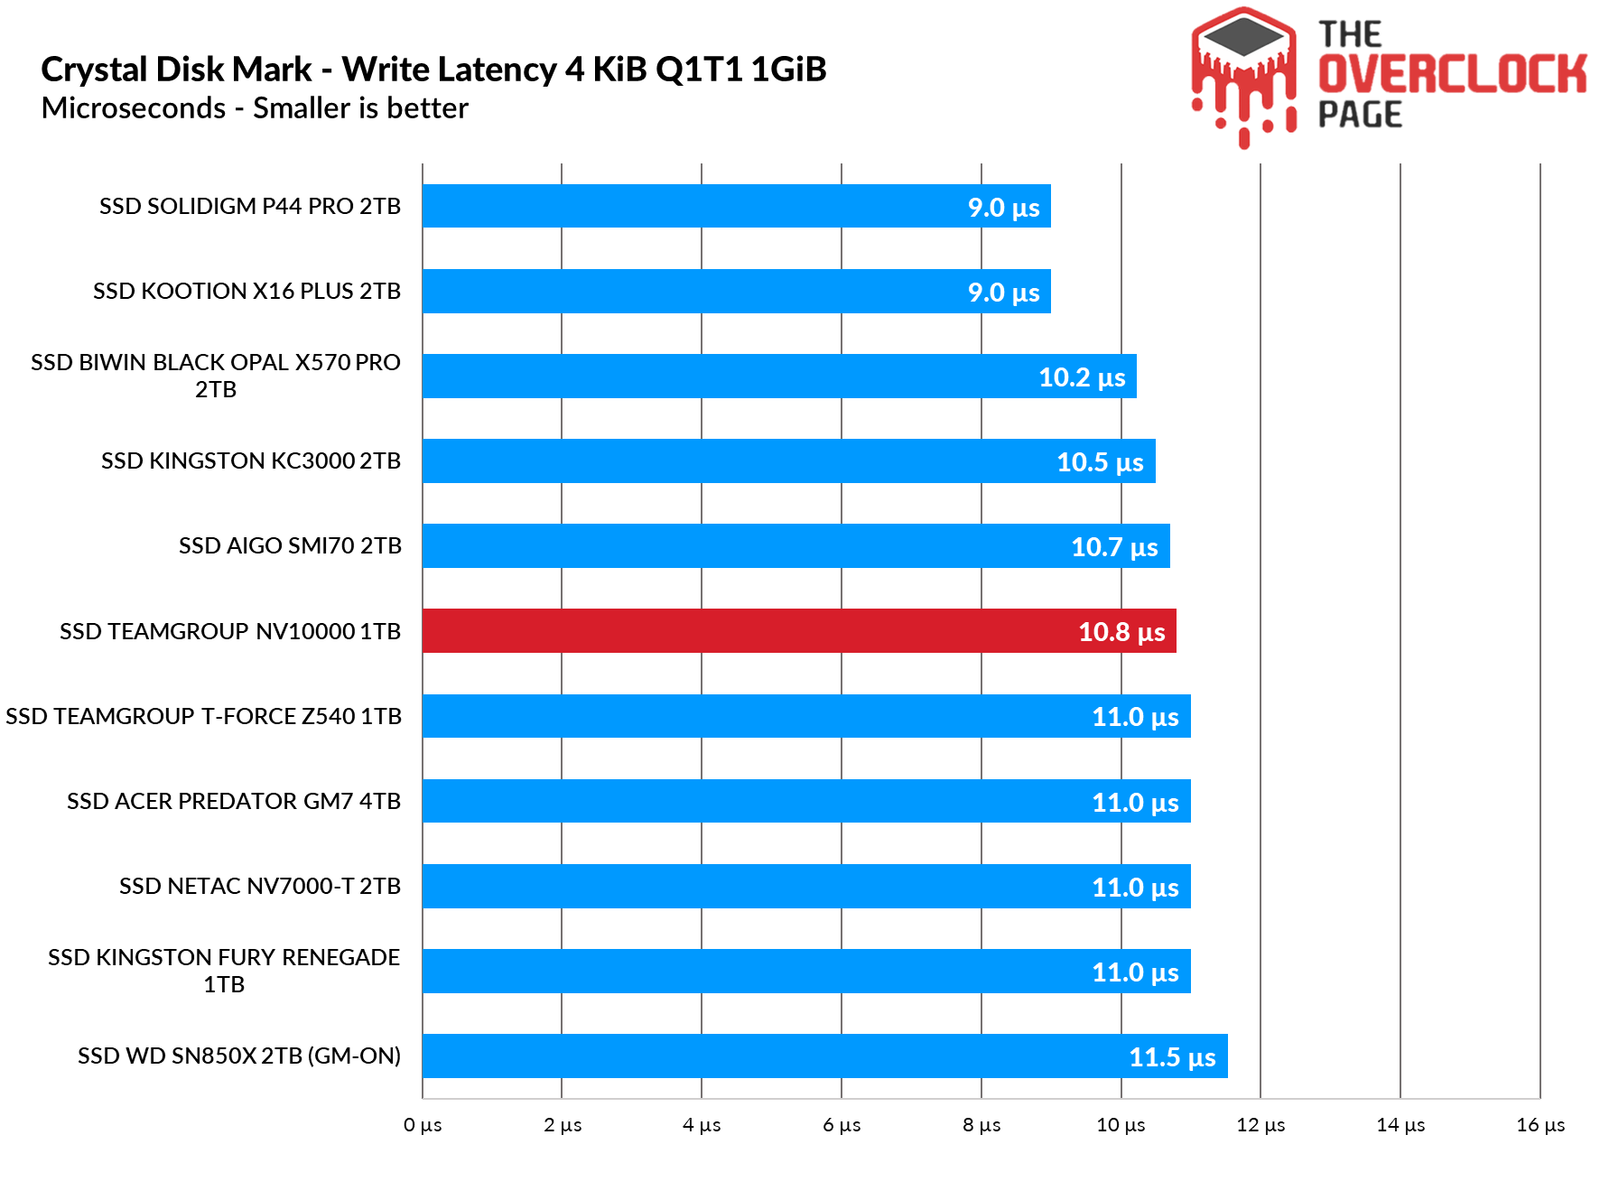
When it comes to its latencies, the Teamgroup performed very well, ranking at the top for reads and in the middle of the table for writes.
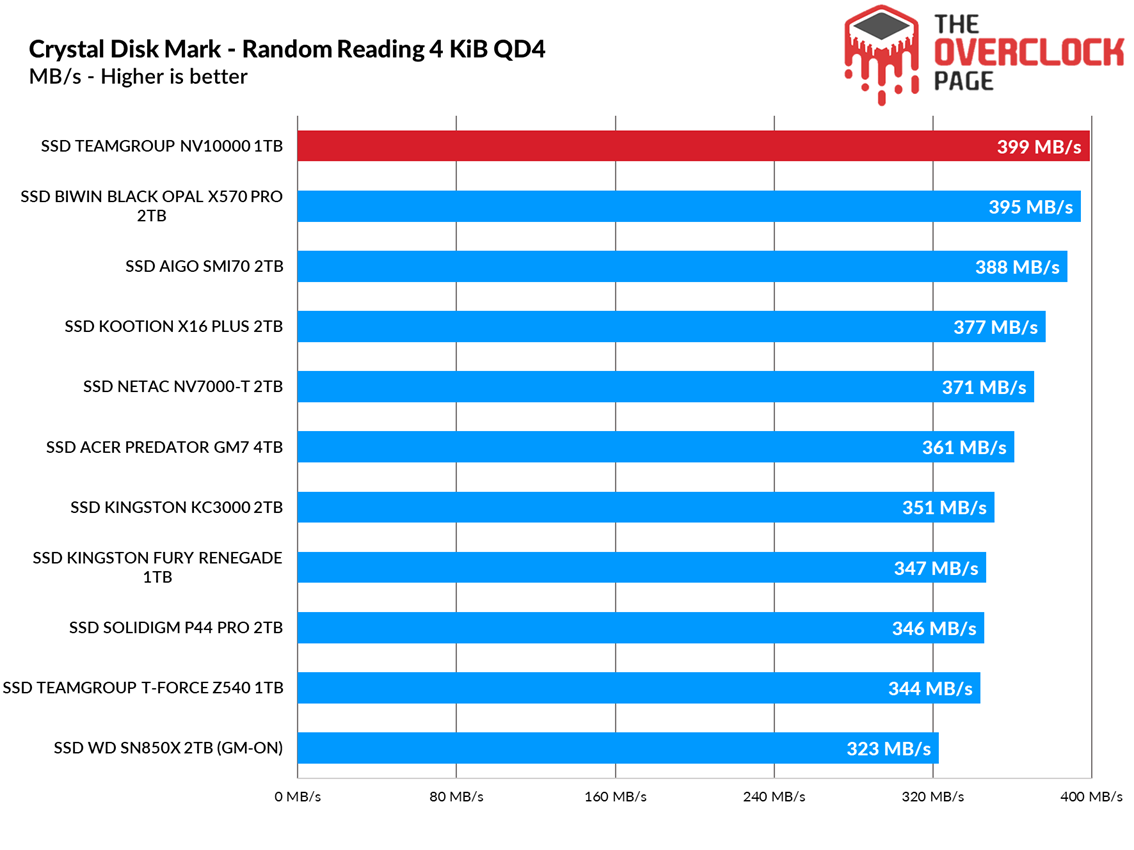
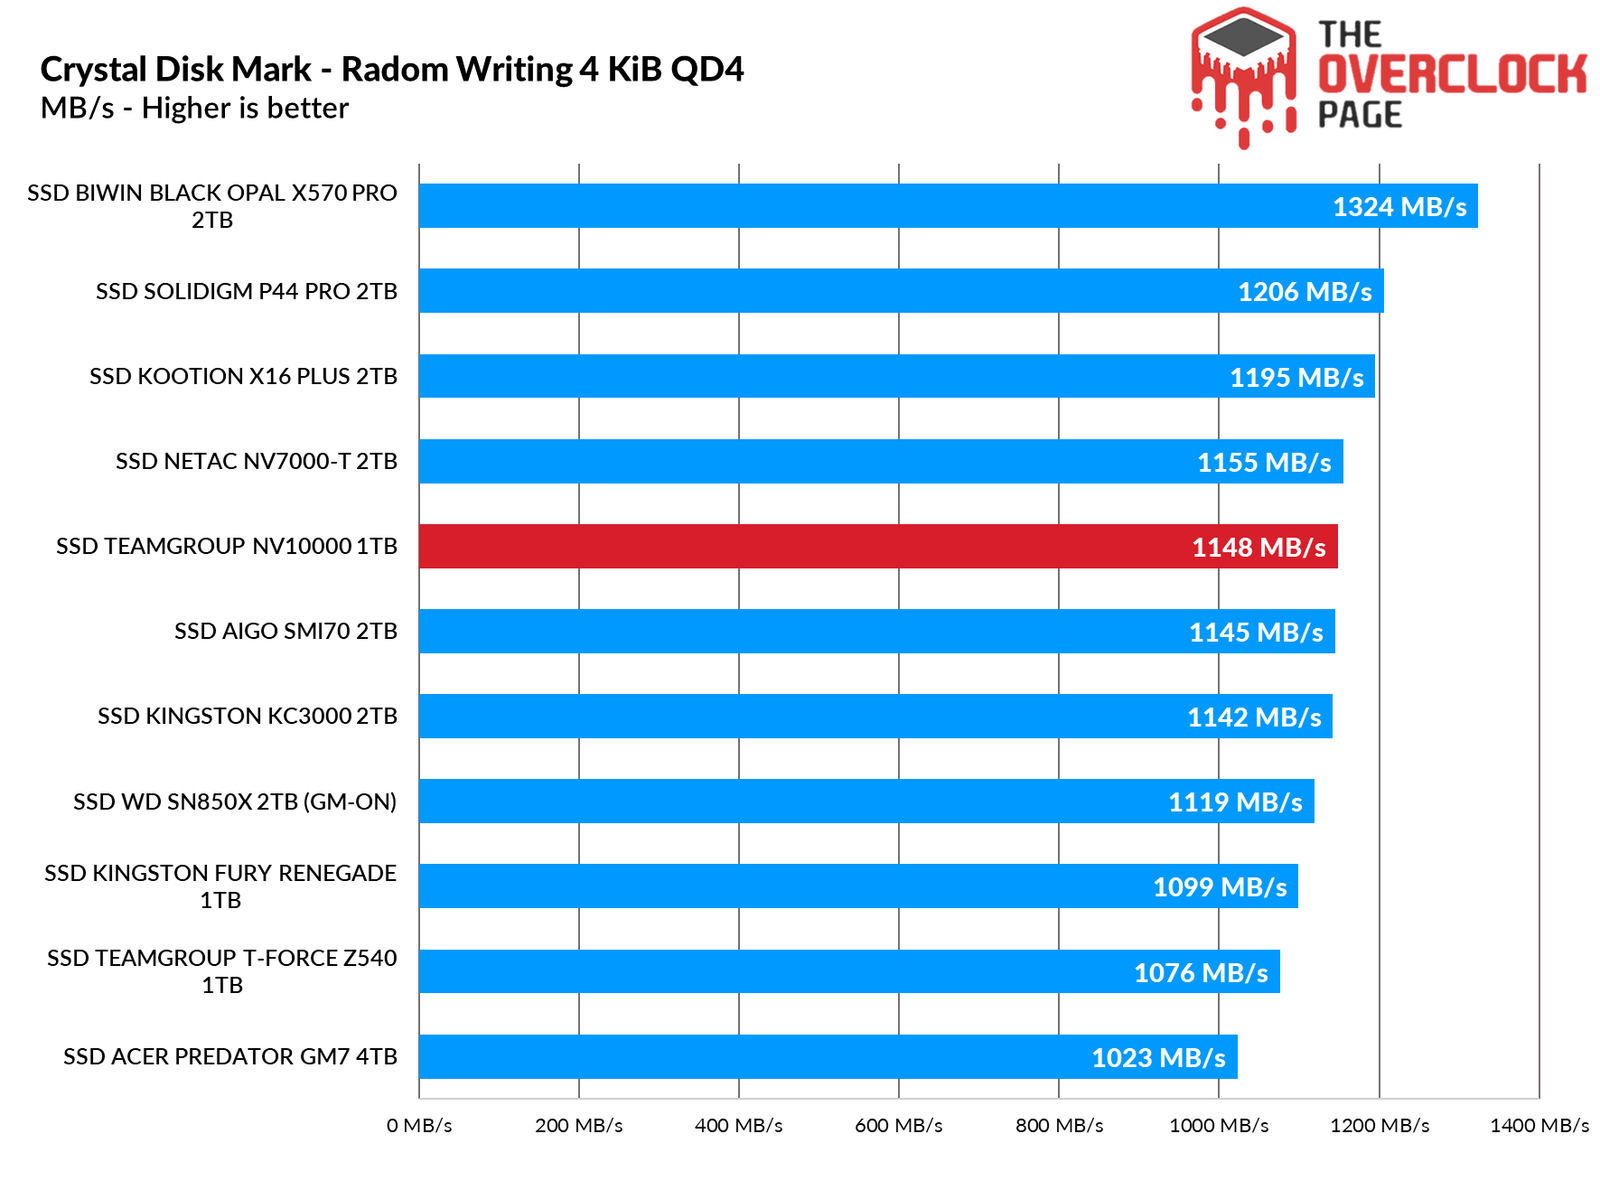
Regarding its random speeds at a ‘Queue depth’ of 4, we observed that the NV10000 ranked at the top for reads, and while its write performance was lower, it still remained in the upper half of the table.
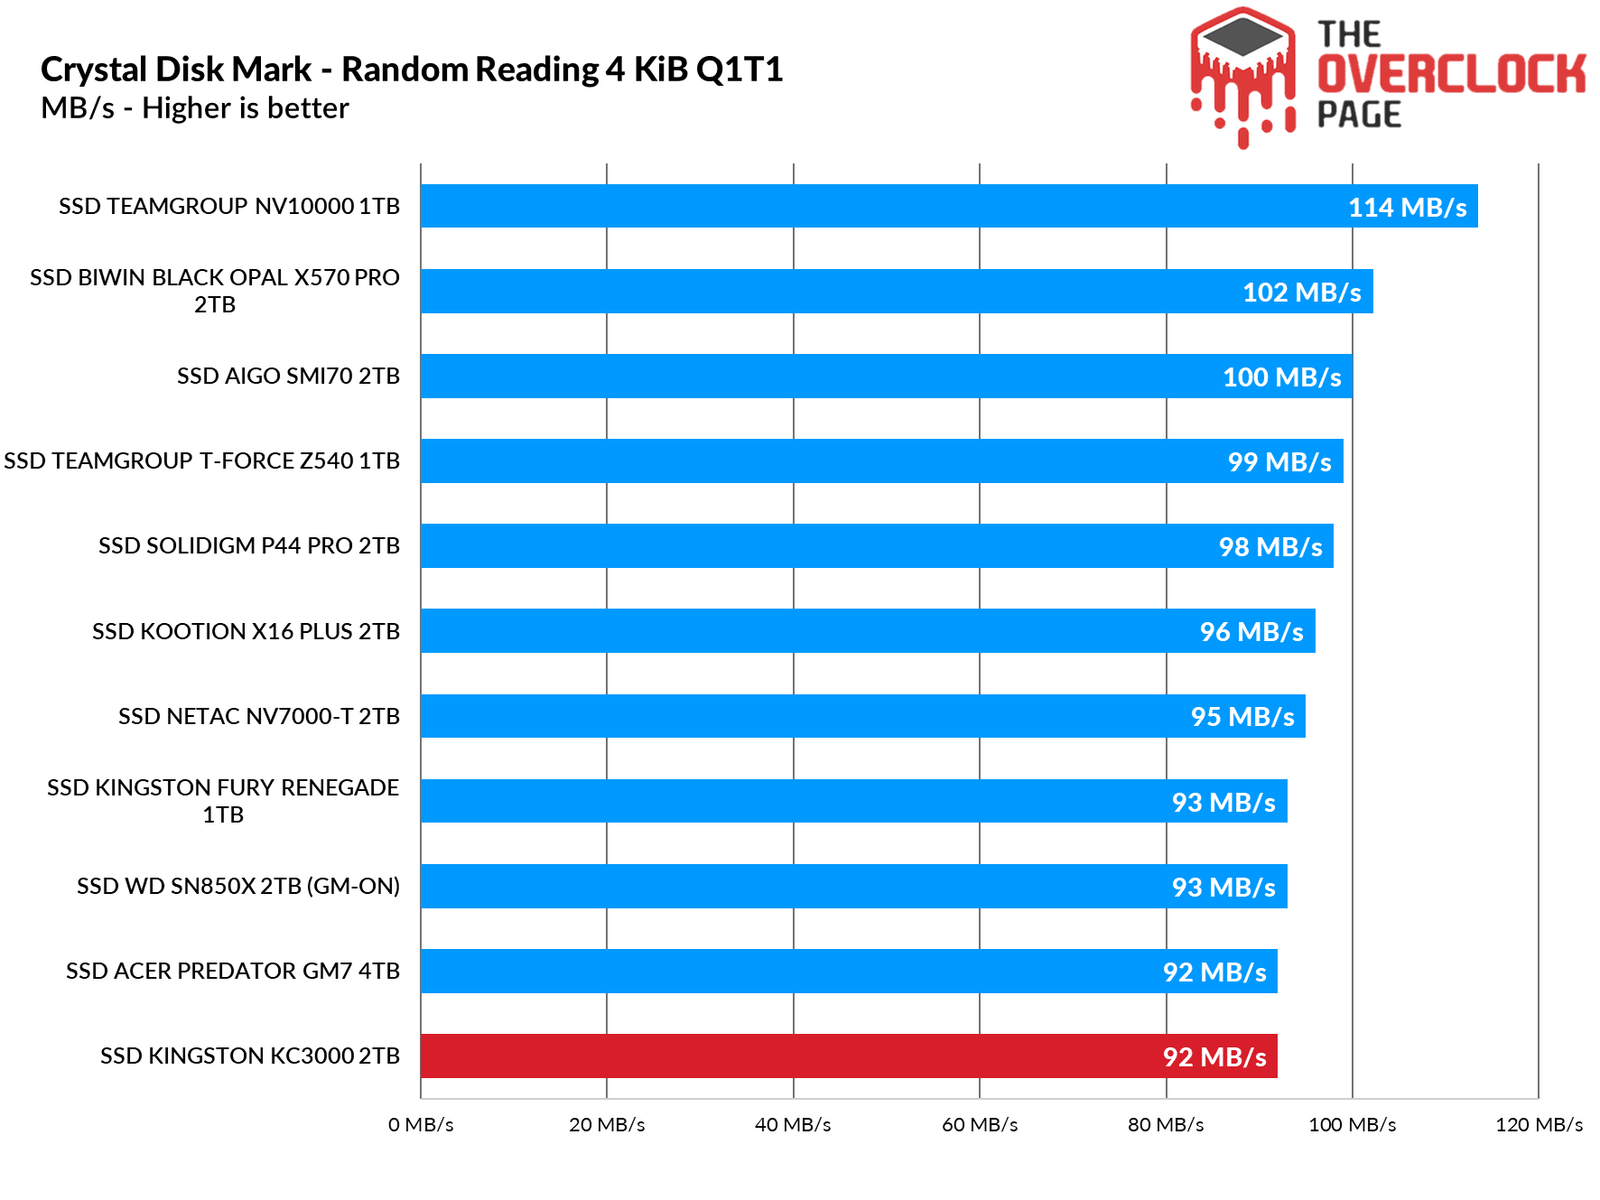
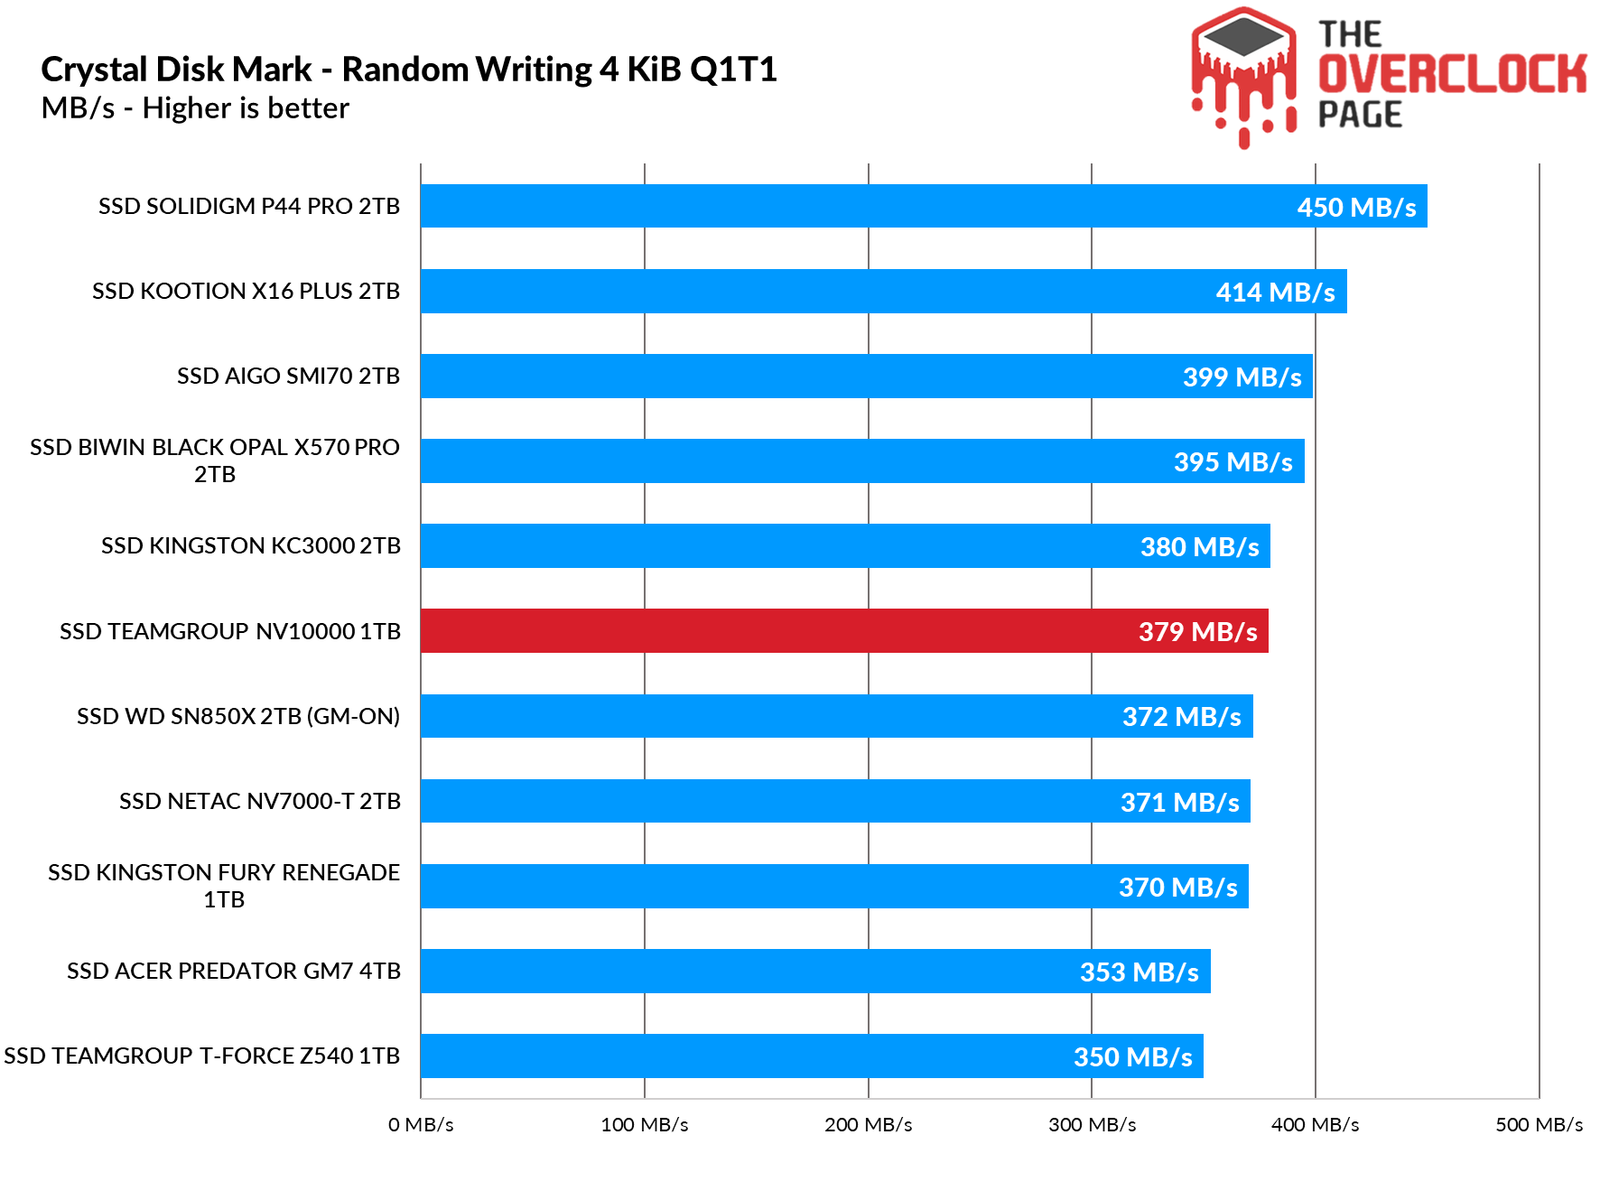
ATTO Disk Benchmark QD1 and QD4
We ran an ATTO test to observe the SSD’s speeds across various block sizes. The benchmark was configured as follows:
Blocks: from 512 Bytes up to 8 MiB,
File size: 256MB,
Queue Depth: 1 and 4.
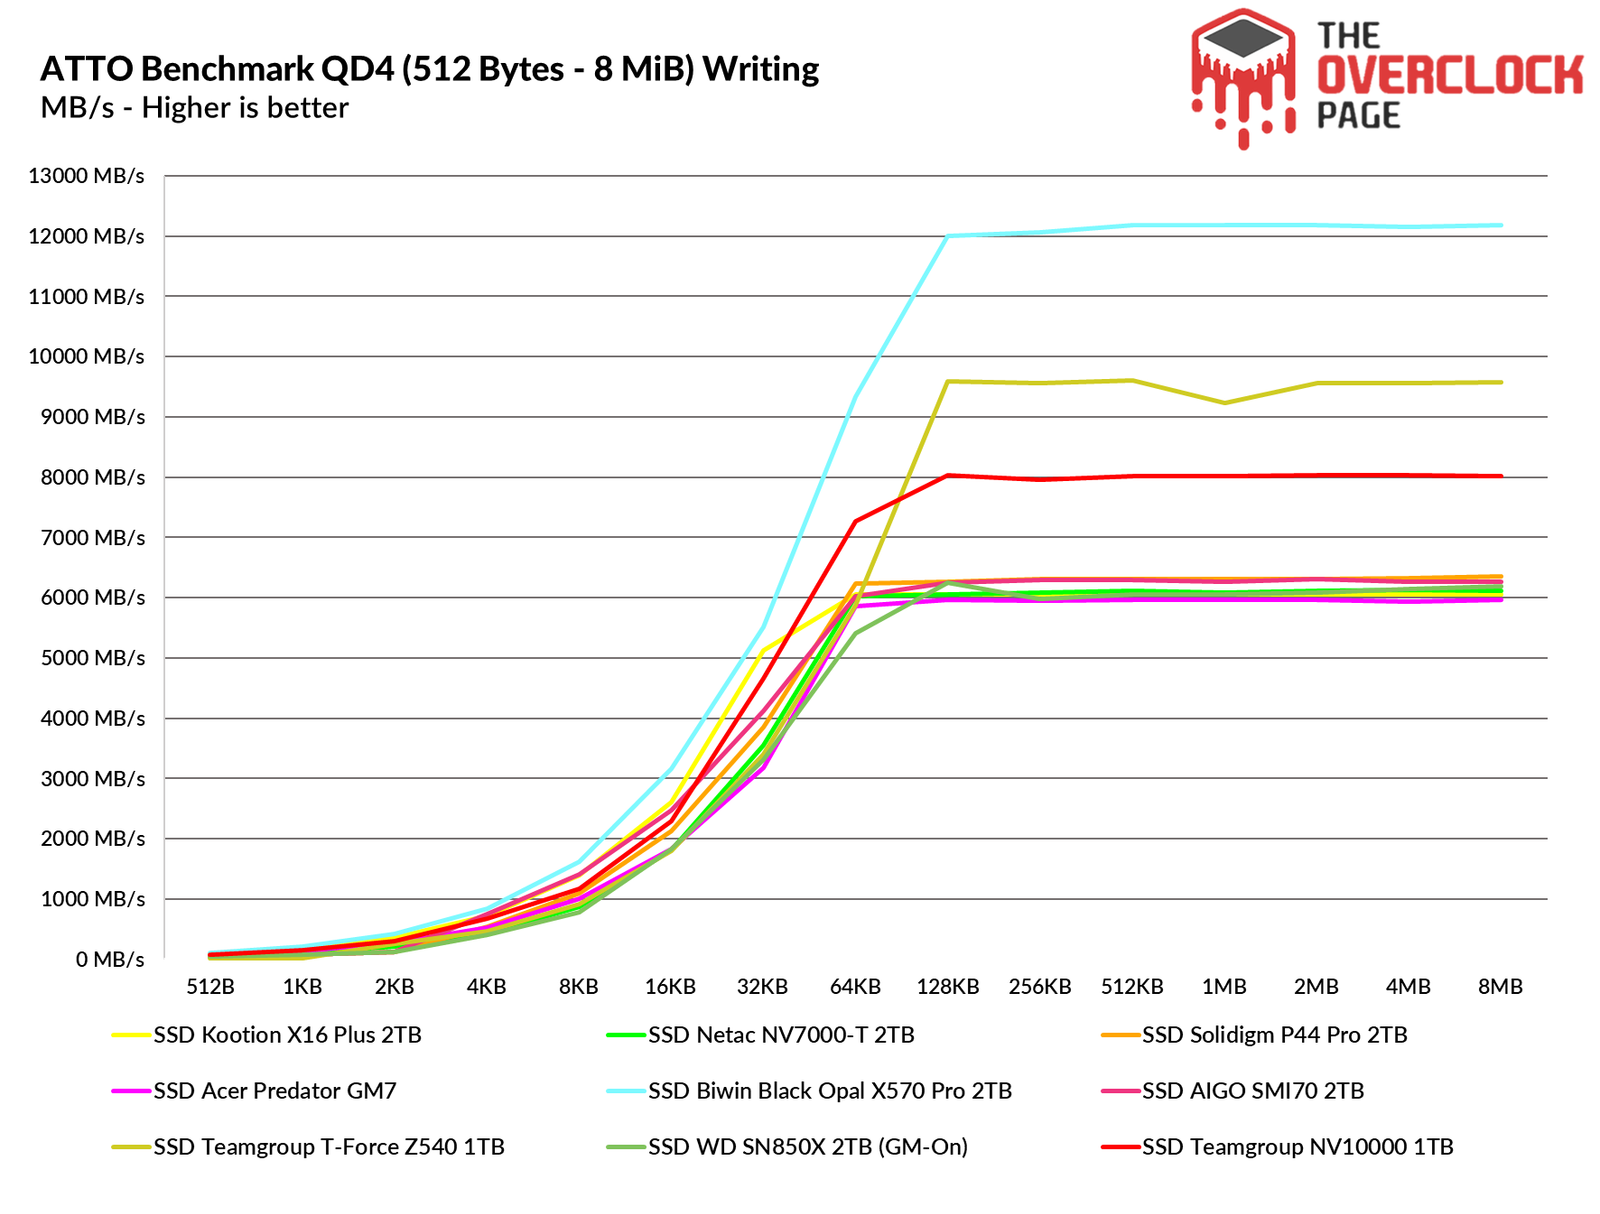
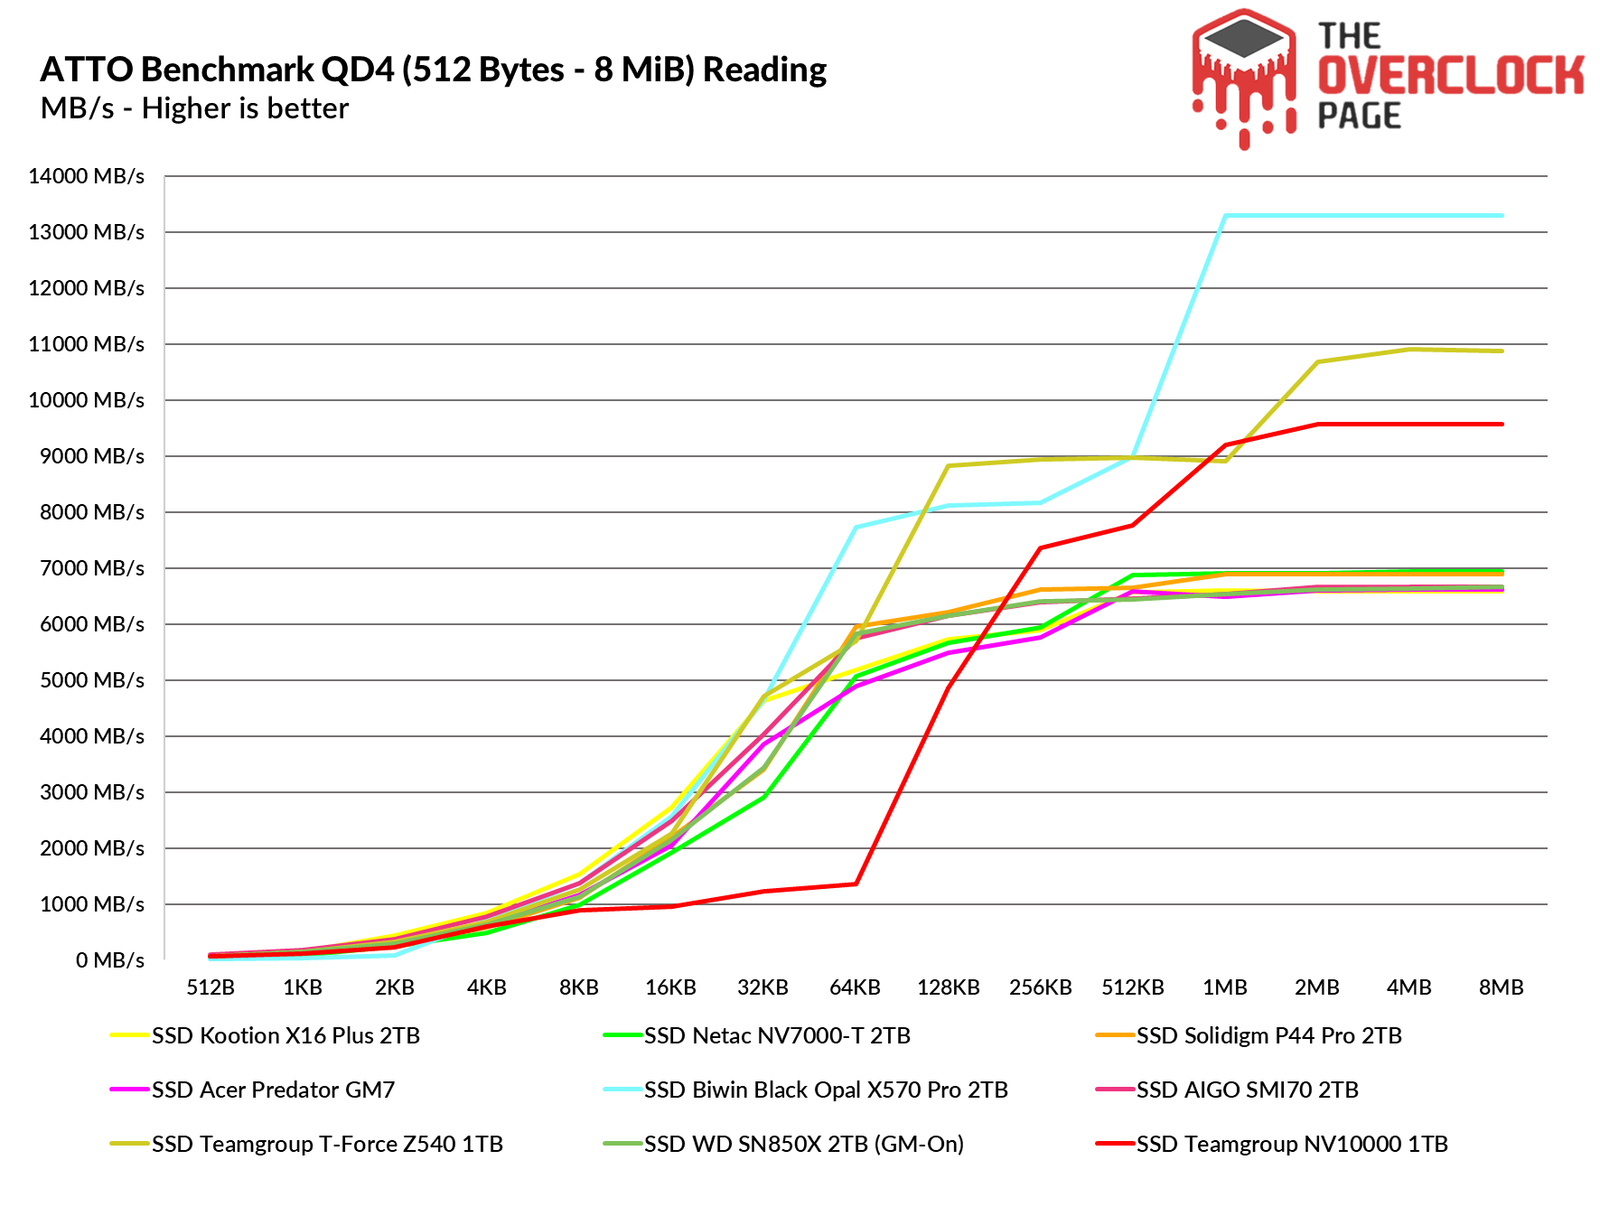
ATTO Disk Benchmark is software that performs sequential speed tests with compressed files, meaning that for simulating a data transfer load like those in Windows, we typically see results around the 128KB to 1MB block sizes. It ended up in the middle of the pack in these tests.
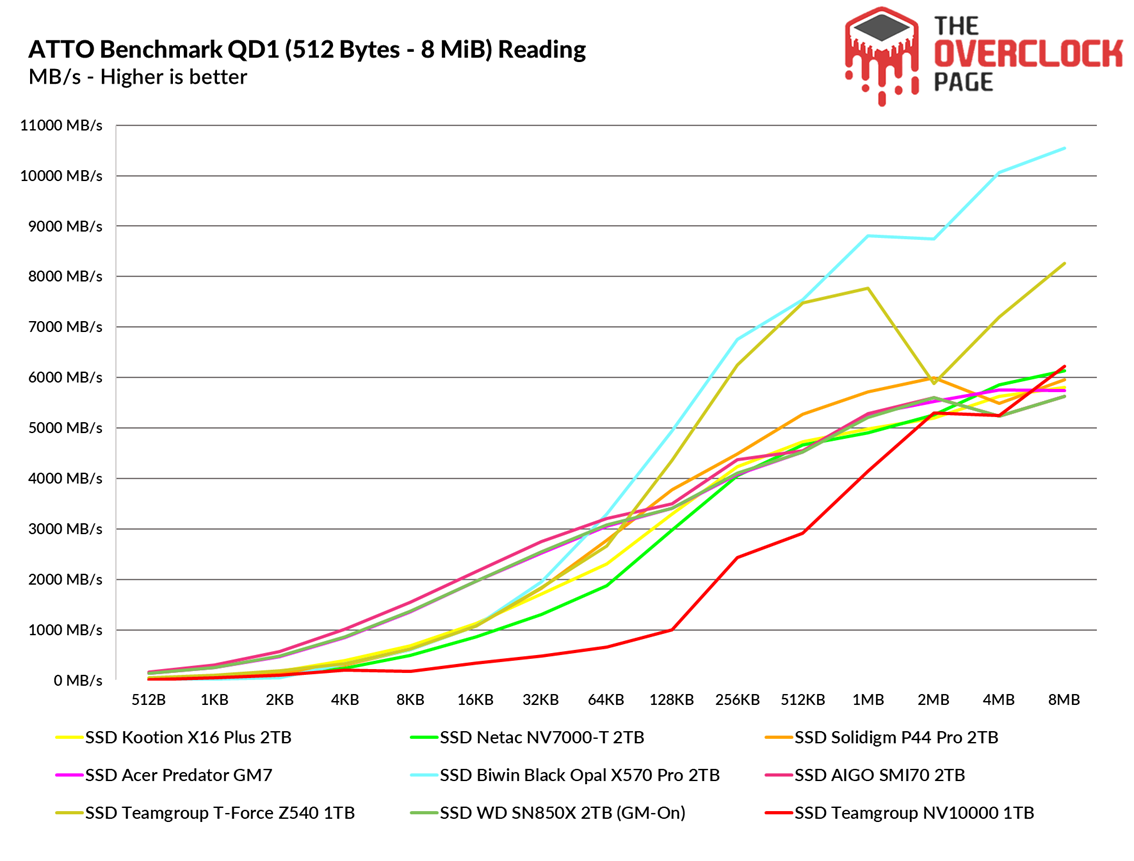
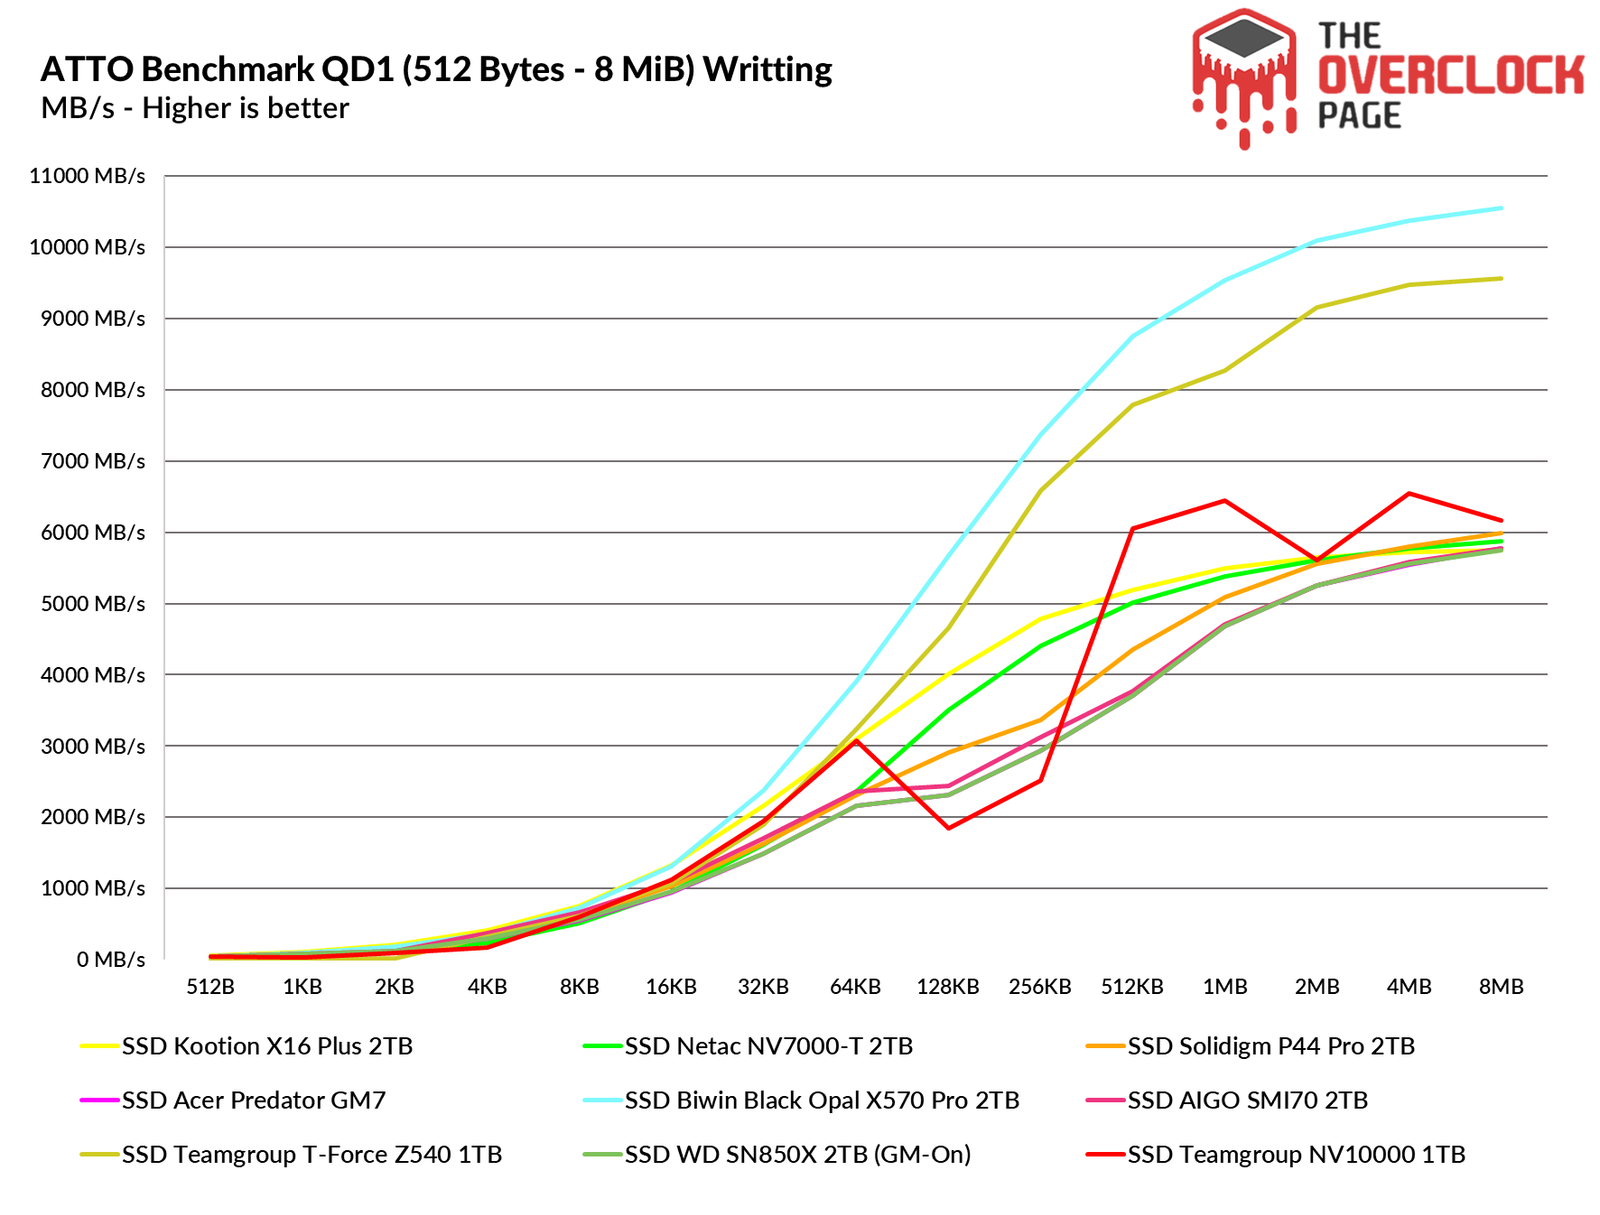
Using QD1, we noticed that for reads from 2MB onwards, it rivals SSDs like the Netac NV7000-T, while its write performance is on par with models such as the Solidigm P44 Pro.
3DMark – Storage Benchmark

This benchmark performs several storage-focused tests, including game loading for titles such as Call of Duty Black Ops 4 and Overwatch, recording and streaming a 1080p 60 FPS gameplay using OBS, installing various games, and transferring files from game folders.
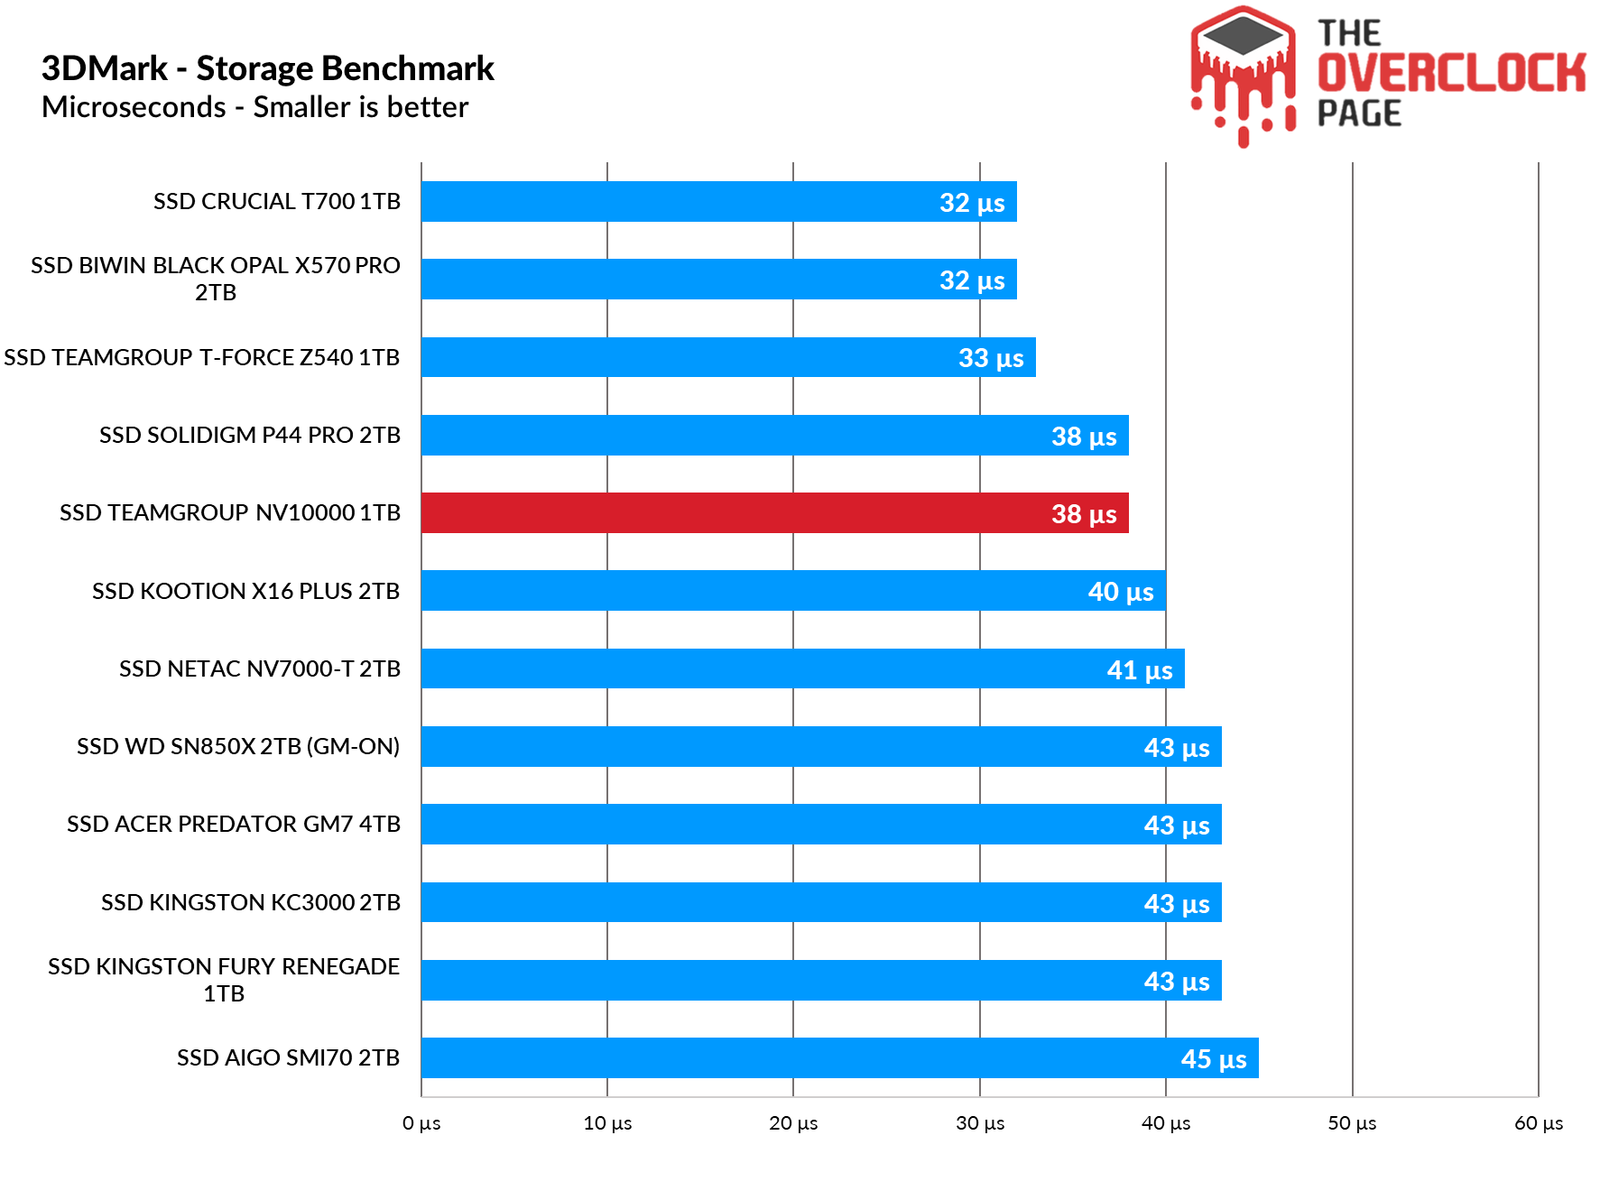
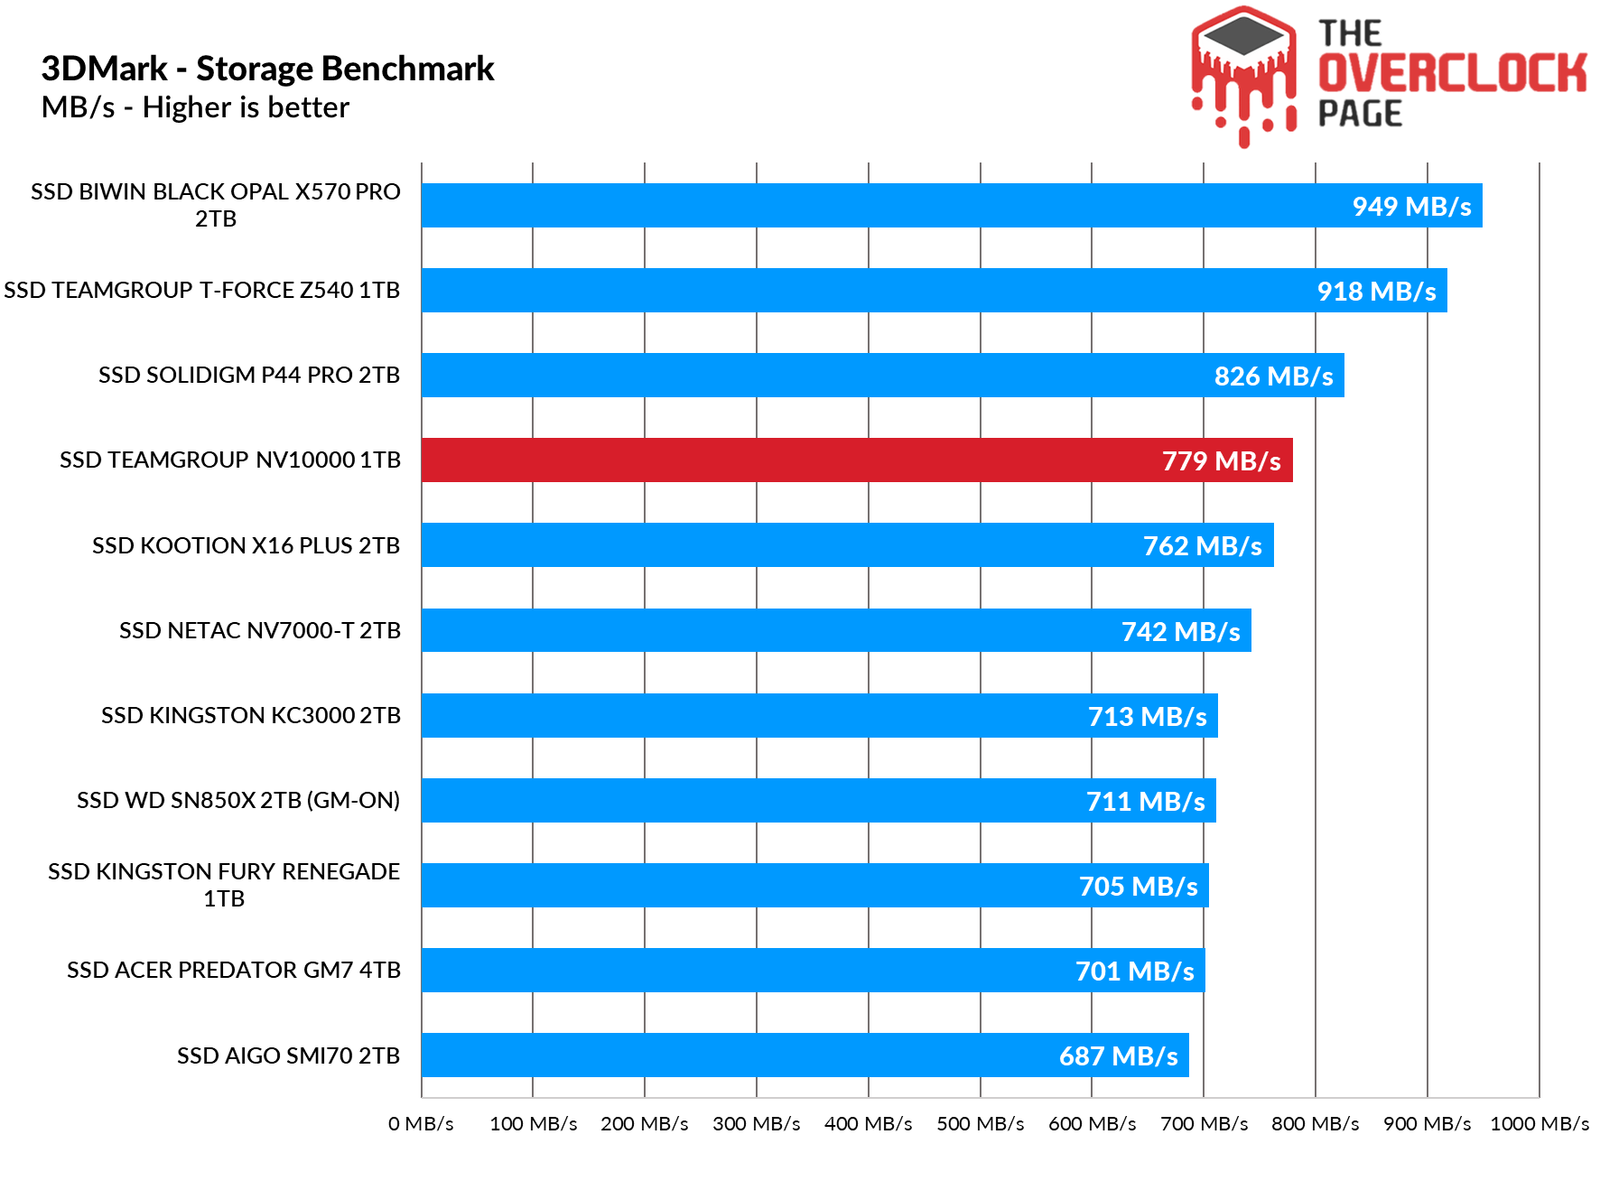
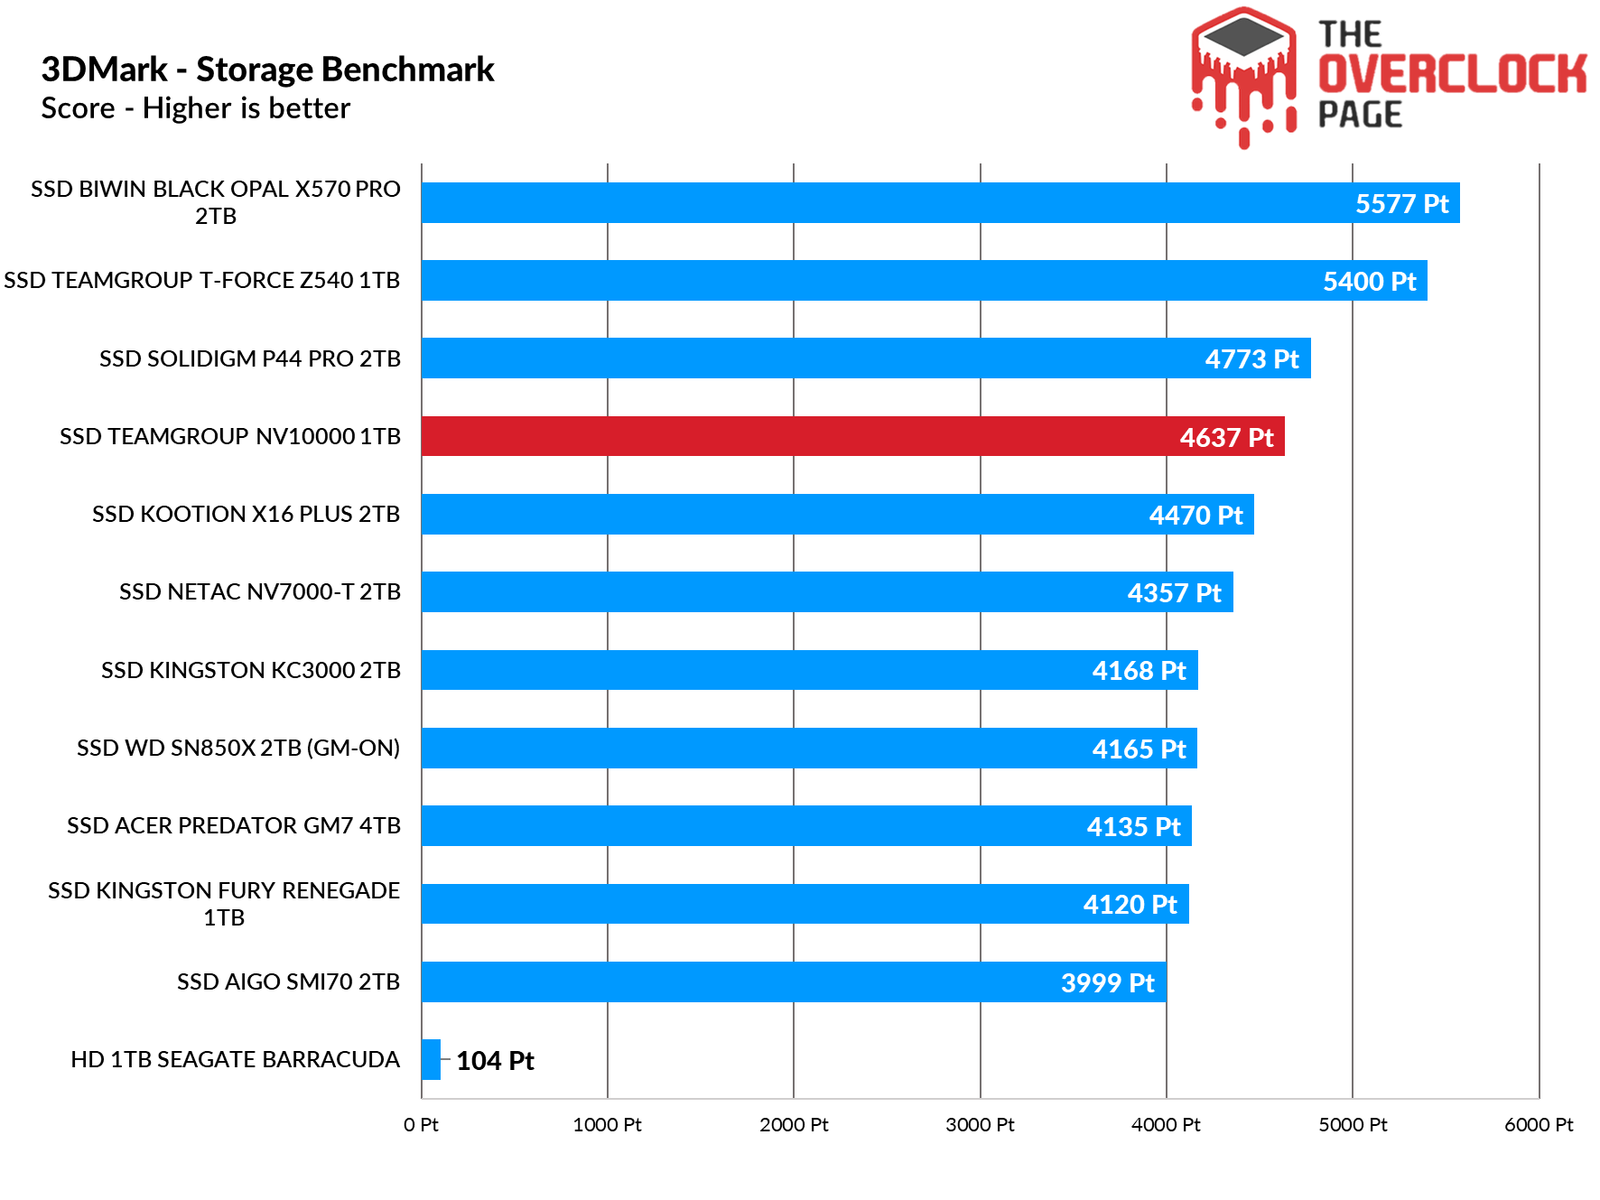
In this benchmark, which features more realistic and traditional everyday usage traces, the NV10000 remained in the upper half of the table, ranking close to high-end Gen4 and Gen5 models.
PCMARK 10 – FULL SYSTEM DRIVE BENCHMARK
In this test, we used the Storage Test tool and the ‘Full System Drive Benchmark,’ which performs both light and heavy tests on the SSD.

Among these traces, we can observe tests such as:
Copying 339 JPEG files (Photos) to another drive (Read)
Windows 10 Boot
Adobe After Effects: Launch until ready for use
Adobe Illustrator: Launch until ready for use
Adobe Premiere Pro: Launch until ready for use
Adobe Lightroom: Launch until ready for use
Adobe Photoshop: Launch until ready for use
Battlefield V: Loading time until main menu
Call of Duty Black Ops 4: Loading time until main menu
Overwatch: Loading time until main menu
Using Adobe After Effects
Using Microsoft Excel
Using Adobe Illustrator
Using Adobe InDesign
Using Microsoft PowerPoint
Using Adobe Photoshop (intensive use)
Using Adobe Photoshop (lighter use)
Copying 4 ISO files, totaling 20GB, to a secondary drive (Write Test)
Copying an ISO file (Read-Write Test)
Copying an ISO file to a secondary drive (Read Test)
Copying 339 JPEG files (Photos) to the tested drive (Write)
Creating copies of these JPEG files (Read-Write)
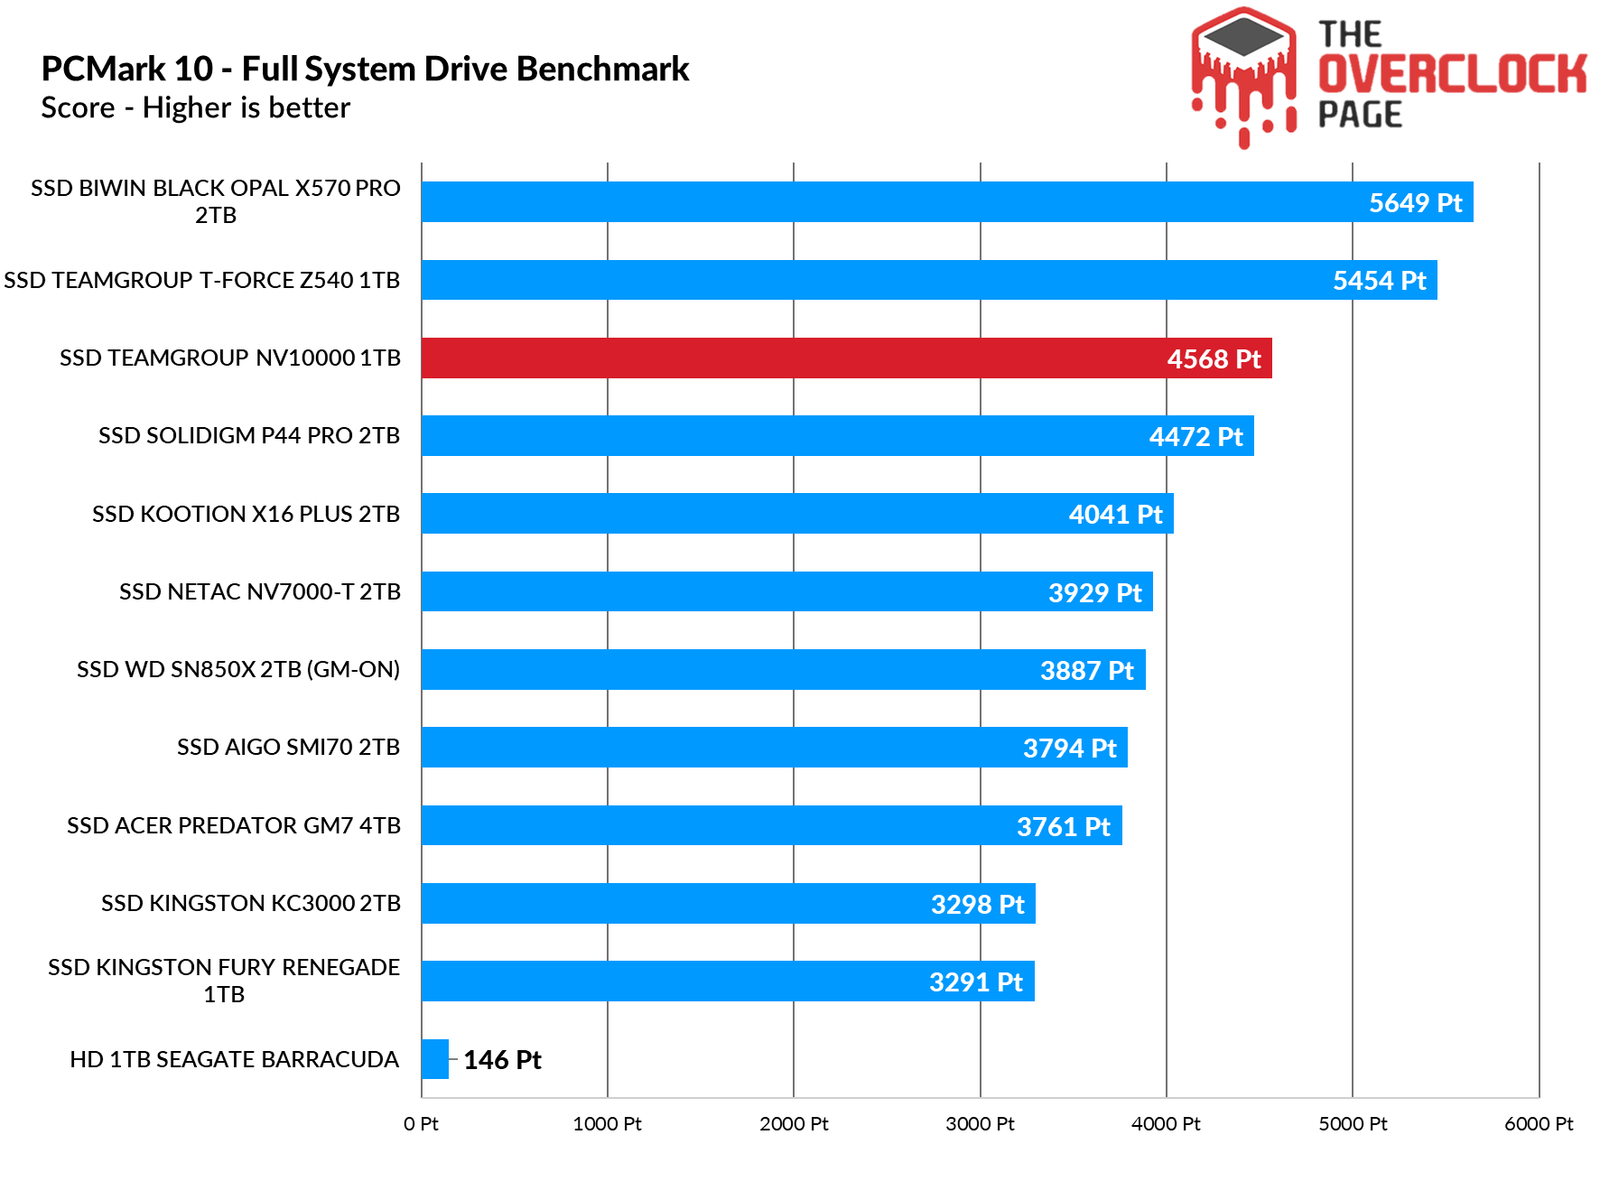
In this other test, which is slightly older and has a greater focus on productivity with higher write demands, the NV10000 outperformed all Gen4 models, trailing only the more sophisticated Gen5 units.
PROJECT TESTING – Adobe Premiere Pro 2021
Next, we used Adobe Premiere to measure the average opening time of a project approximately 16.5GB in size with 4K resolution and a 120Mbps bitrate, fully loaded with effects until it was ready for editing. It is worth noting that the SSD being tested is always used as a secondary drive without an operating system installed, as this could affect the results and lead to inconsistencies.
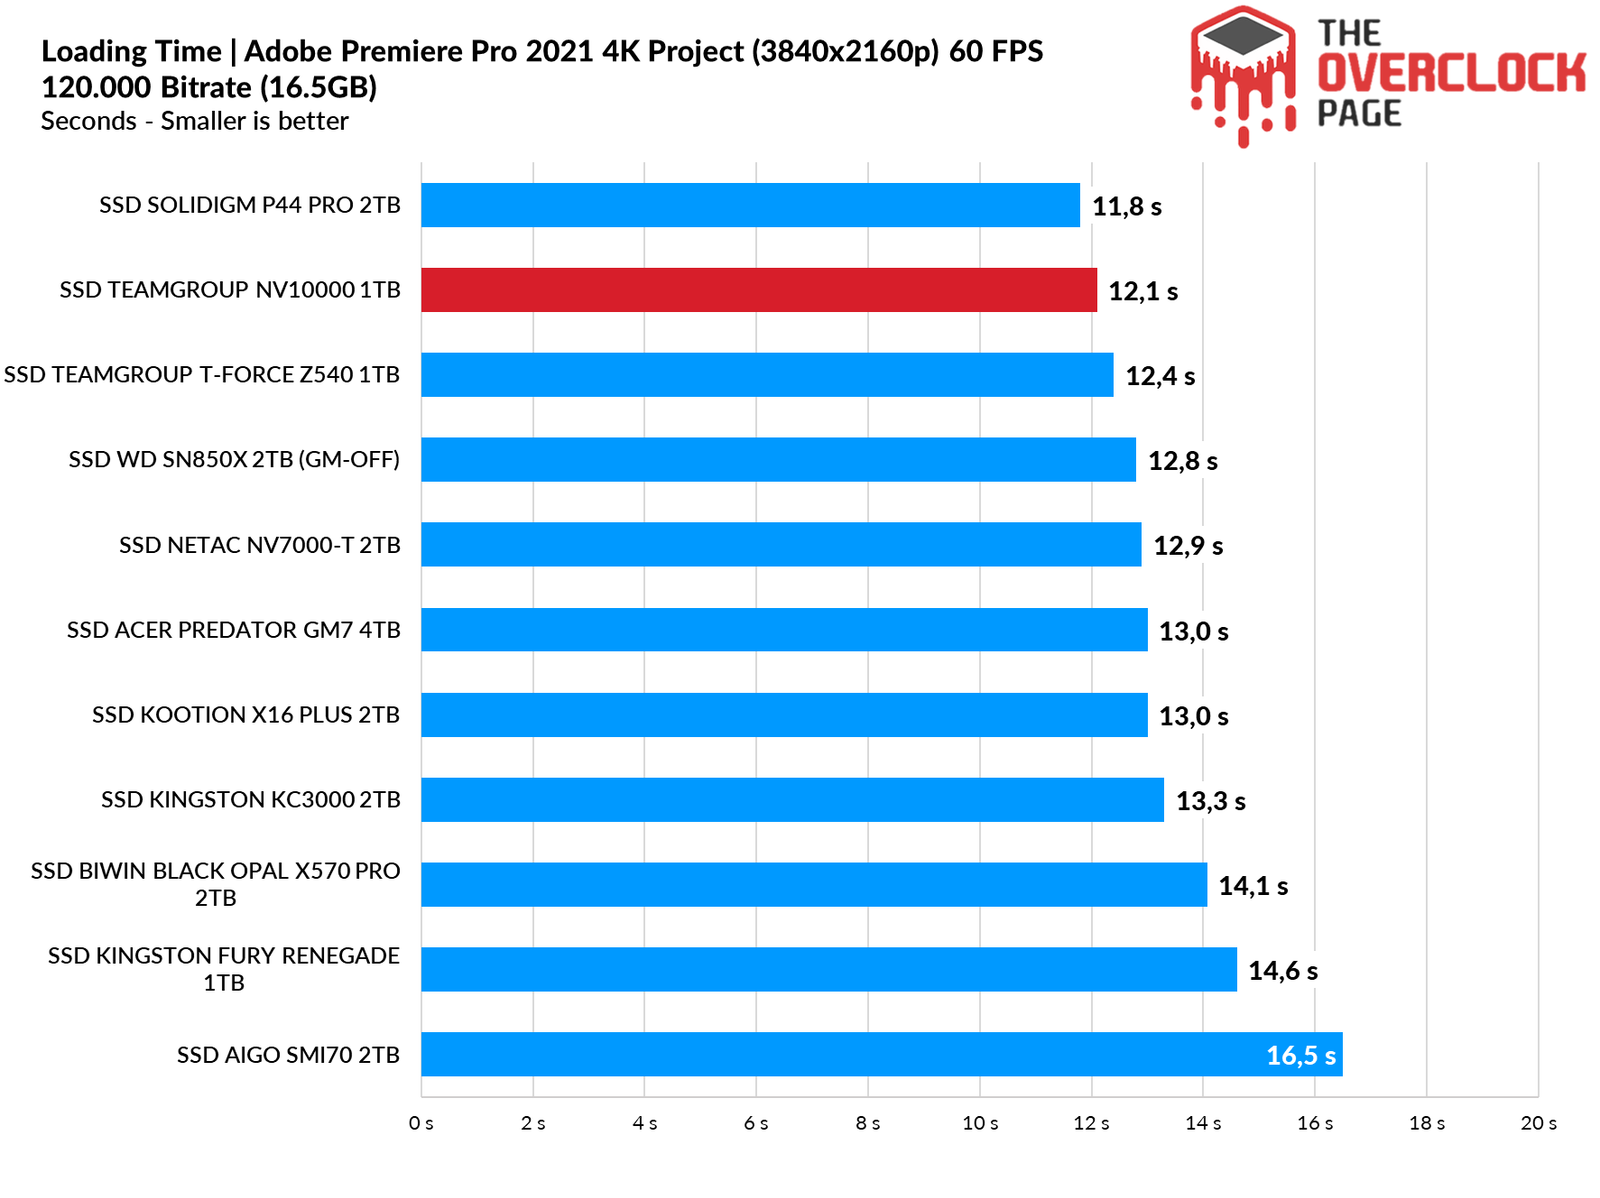
When we used Premiere to load a project of over 16GB, the NV10000 performed very well, ranking second in the comparison.
GAME AND WINDOWS LOADING TIME TEST
We conducted a comparison between multiple SSDs and an HDD, using a clean installation of Windows 10 Build 21H1 along with the Final Fantasy XIV benchmark opening campaign mode. The test records the best result after three consecutive system boots, considering the total time until reaching the desktop with the score reported by the application, which is why it is slower than just booting to show the desktop screen.
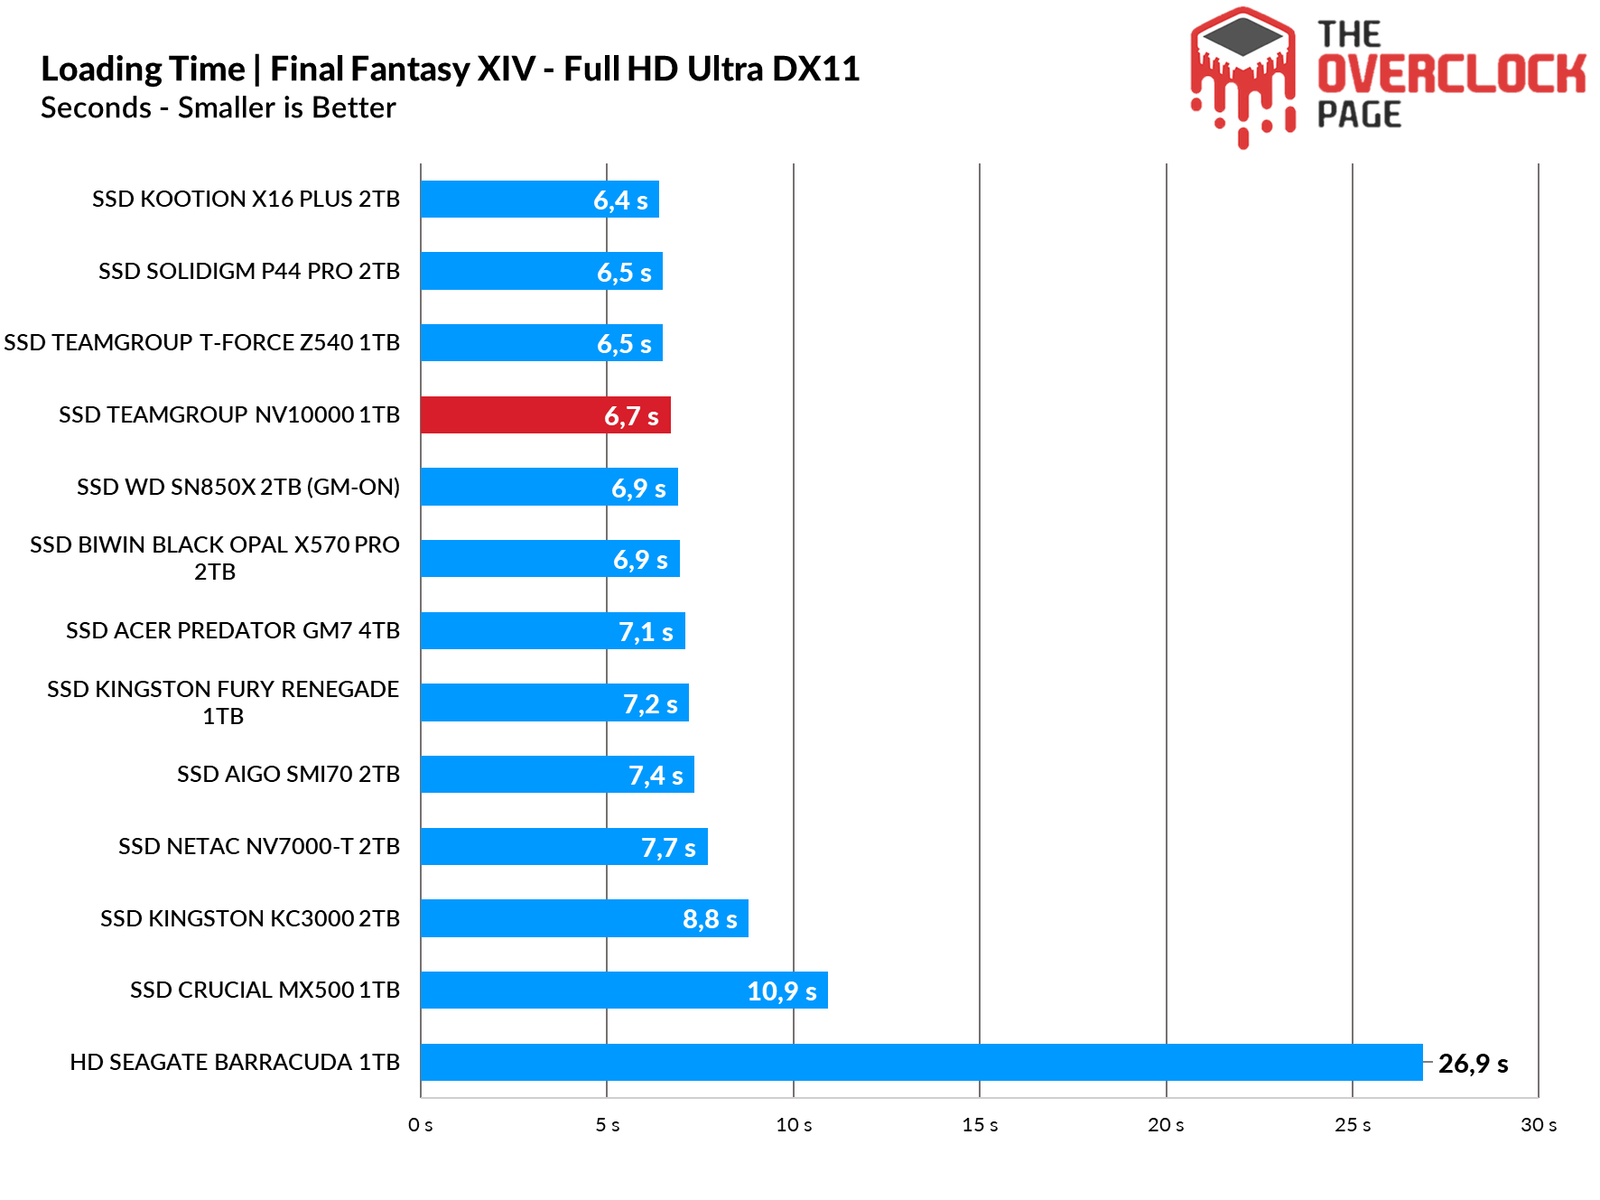
In this game, the Teamgroup took 6.7 seconds to load all textures and scenes for the benchmark, which was a solid result, falling only slightly behind the Z540.
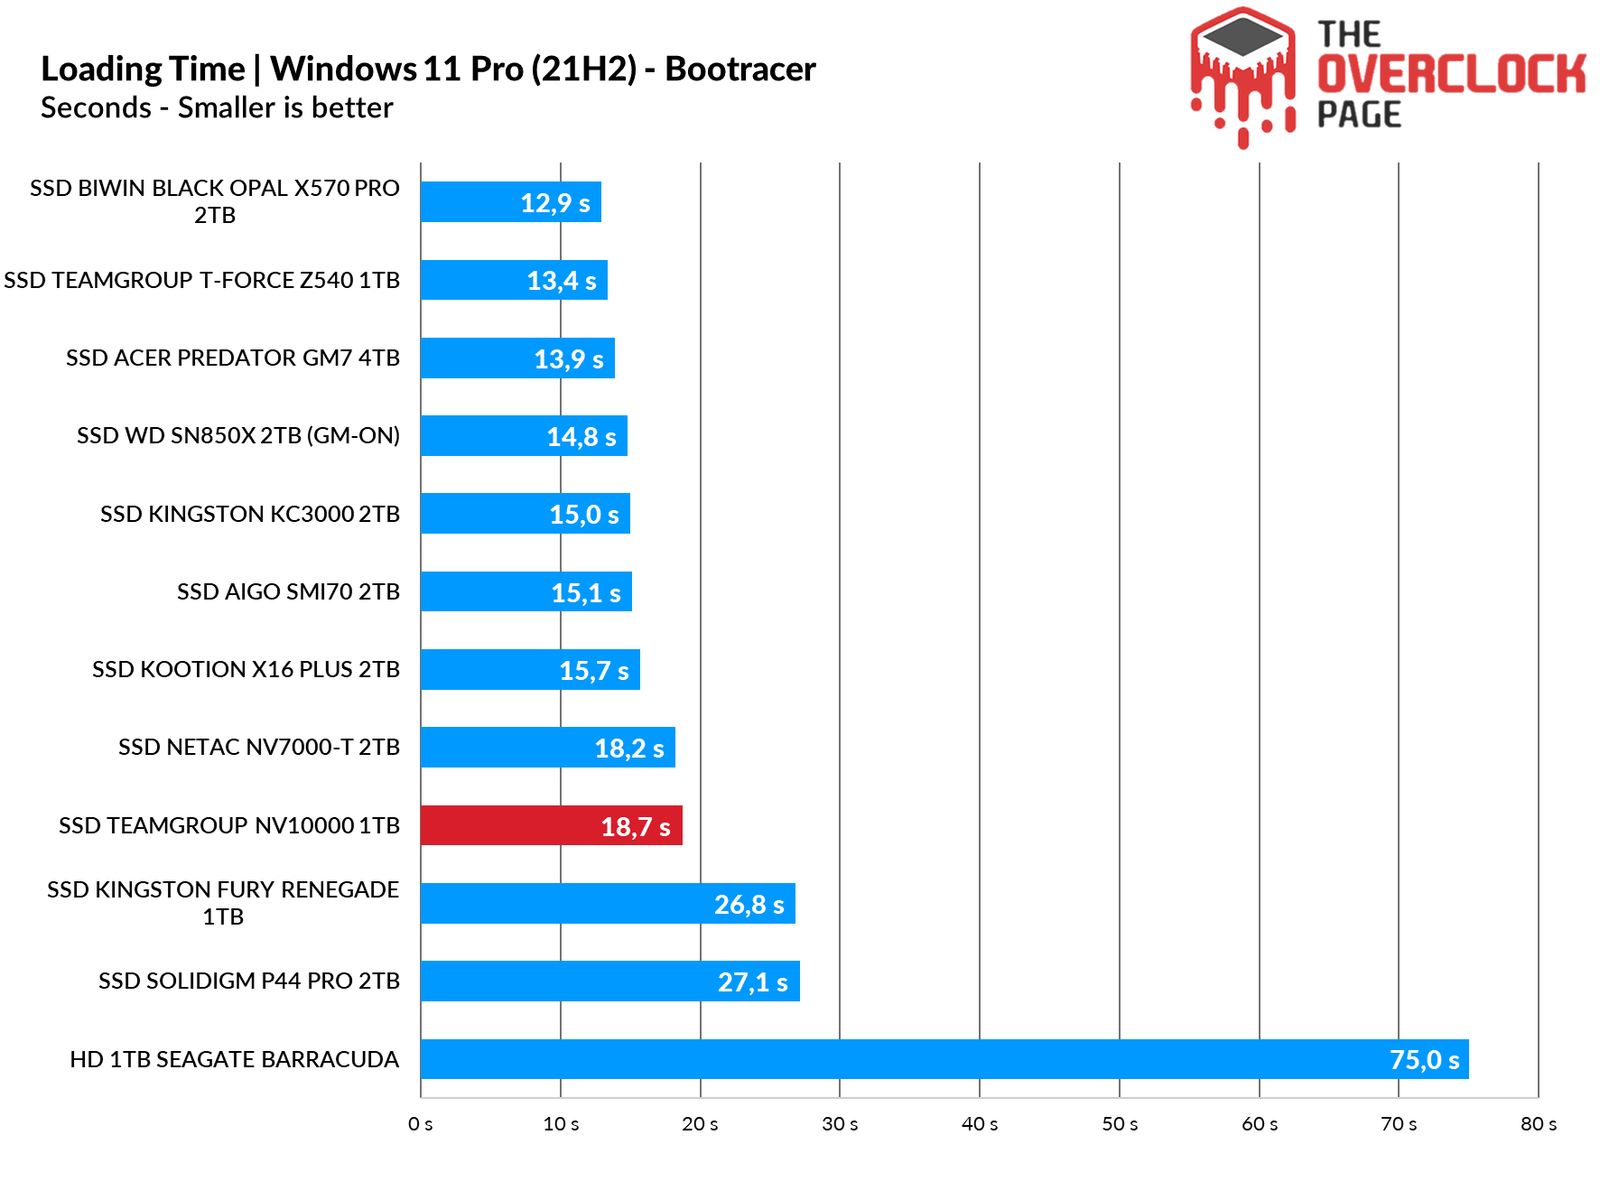
In this program, it records the boot time until the final OS drivers are loaded. In this specific instance, a clean installation was performed using only essential system drivers, such as Network, Wireless + Bluetooth, Audio, Nvidia Drivers, and PCH, among others. Therefore, we can see that the NV10000 didn’t perform very well here, even though the difference was less than 6 seconds compared to first place.
SUSTAINED SPEED TEST | SLC CACHING
A large portion of SSDs currently on the market use SLC Caching technology as a basis, in which a certain percentage of its storage capacity, whether it be MLC (2 bits per cell), TLC (3 bits per cell), or QLC (4 bits per cell), is used to store only 1 bit per cell. It is used as a read and write buffer where the controller starts the writing process, and when the buffer is exhausted, it writes to the native NAND Flash (MLC / TLC / QLC).

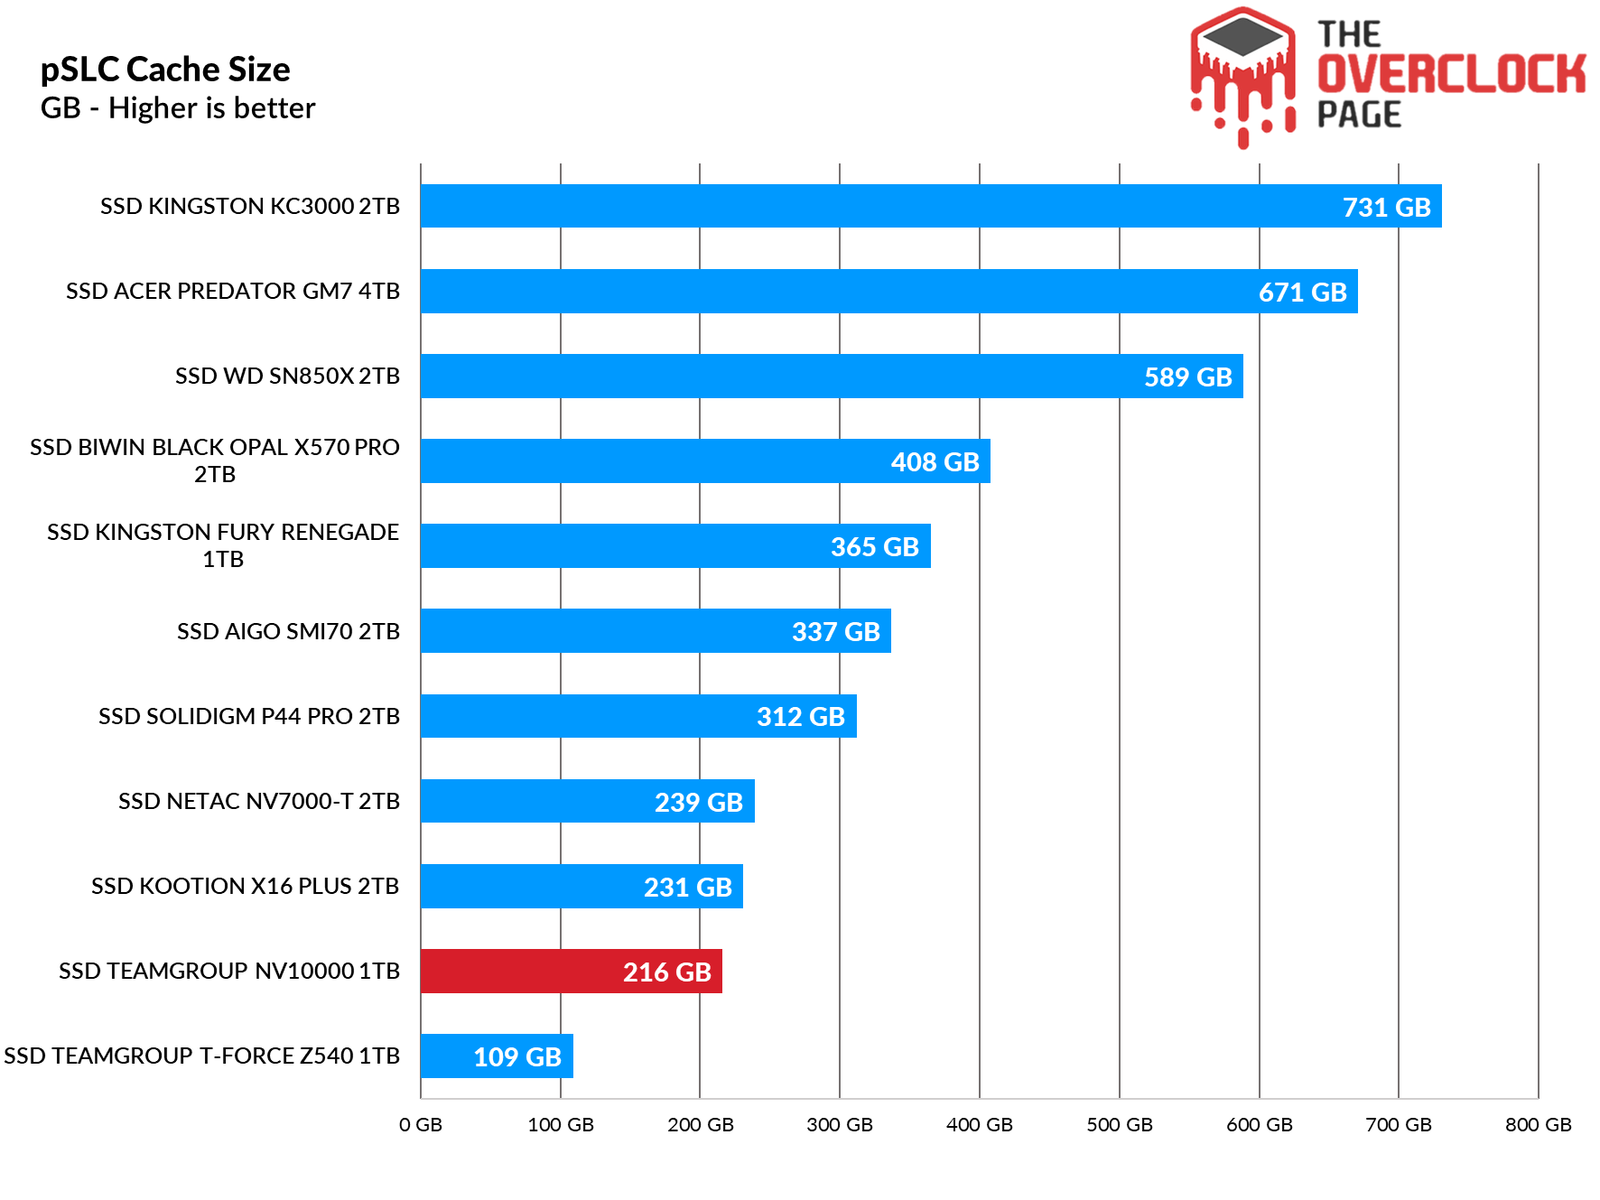
Through IOmeter, we can get an idea of the SSD’s SLC cache volume, as manufacturers often don’t disclose this value. Based on our testing, it appears to have a pSLC Cache volume of around 216GB, maintaining an average speed of ~8545MB/s until the buffer is exhausted.
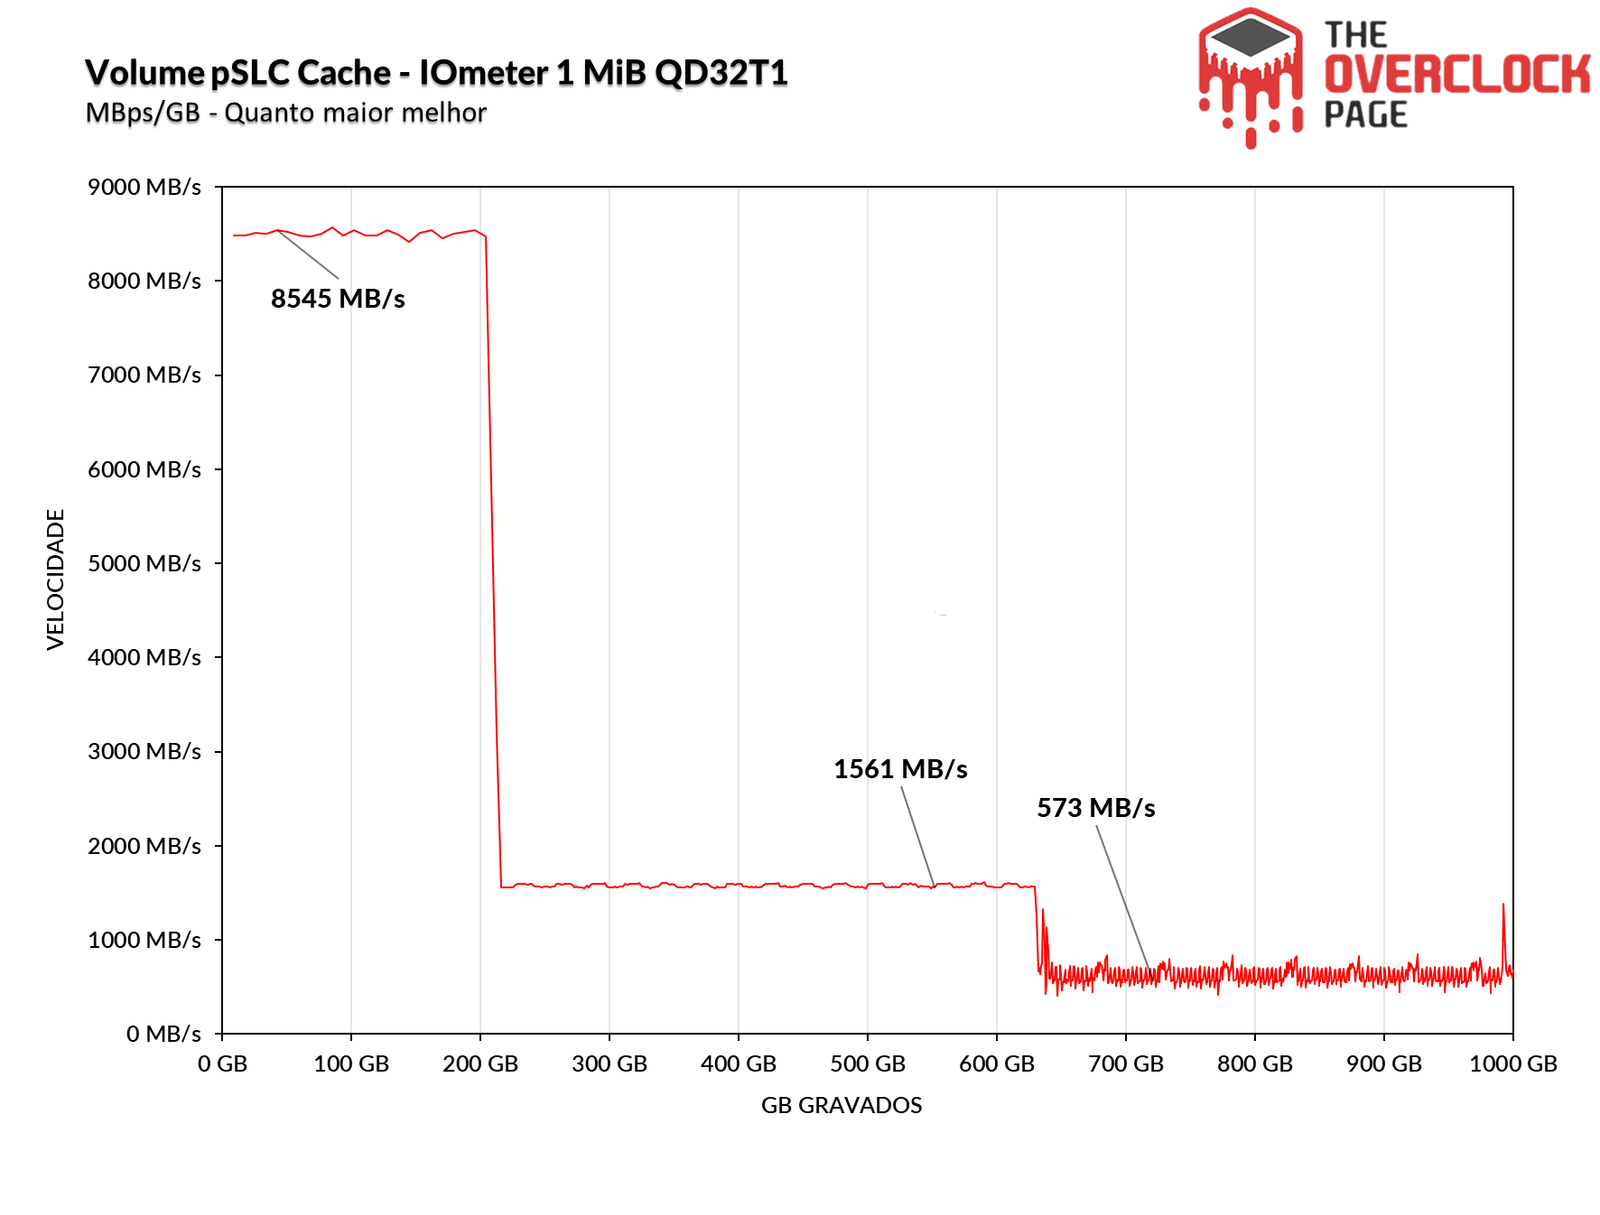
After writing 216GB, it began writing to the blocks natively programmed as TLC, where its average speed was approximately 1561 MB/s, which is quite good. It maintained this average from the 216GB mark up to about 630GB.
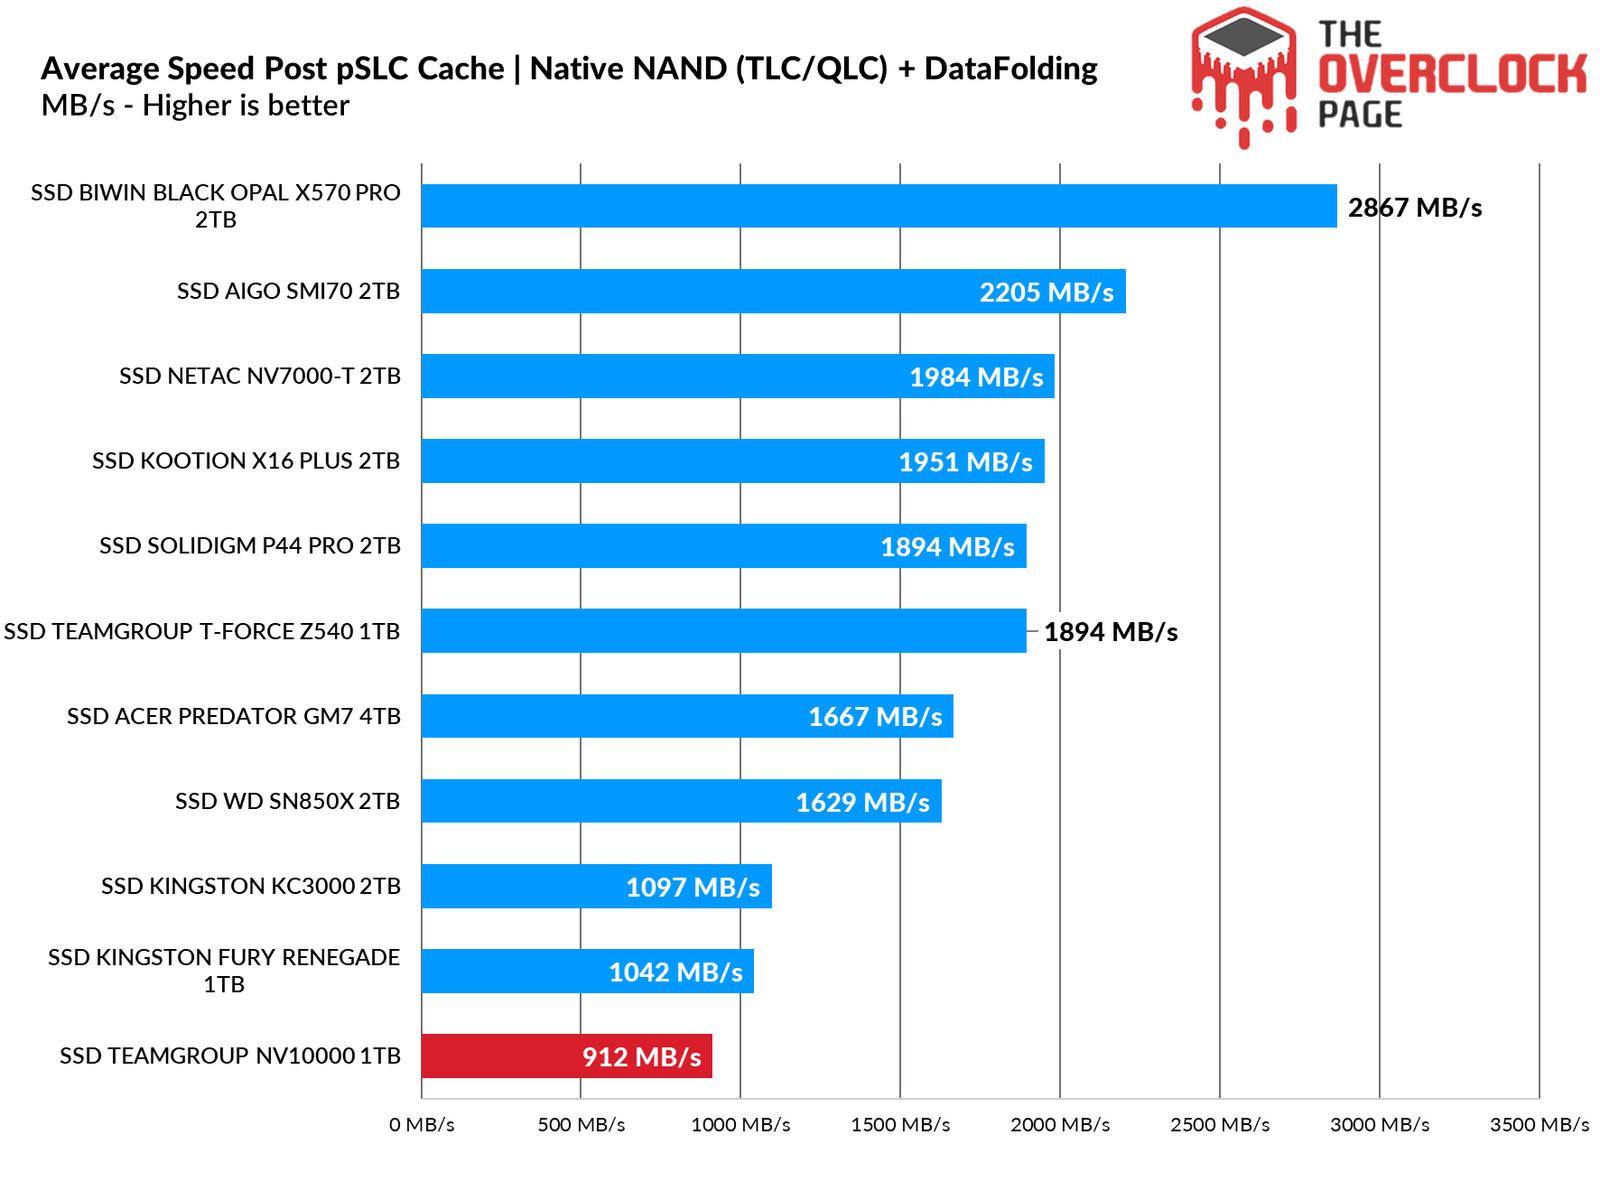
After 630GB, it initiated the folding process, reprogramming the blocks that were in pSLC mode back to TLC, resulting in a significant drop in performance. The SSD then maintained an average write speed of 573 MB/s until the drive was full.
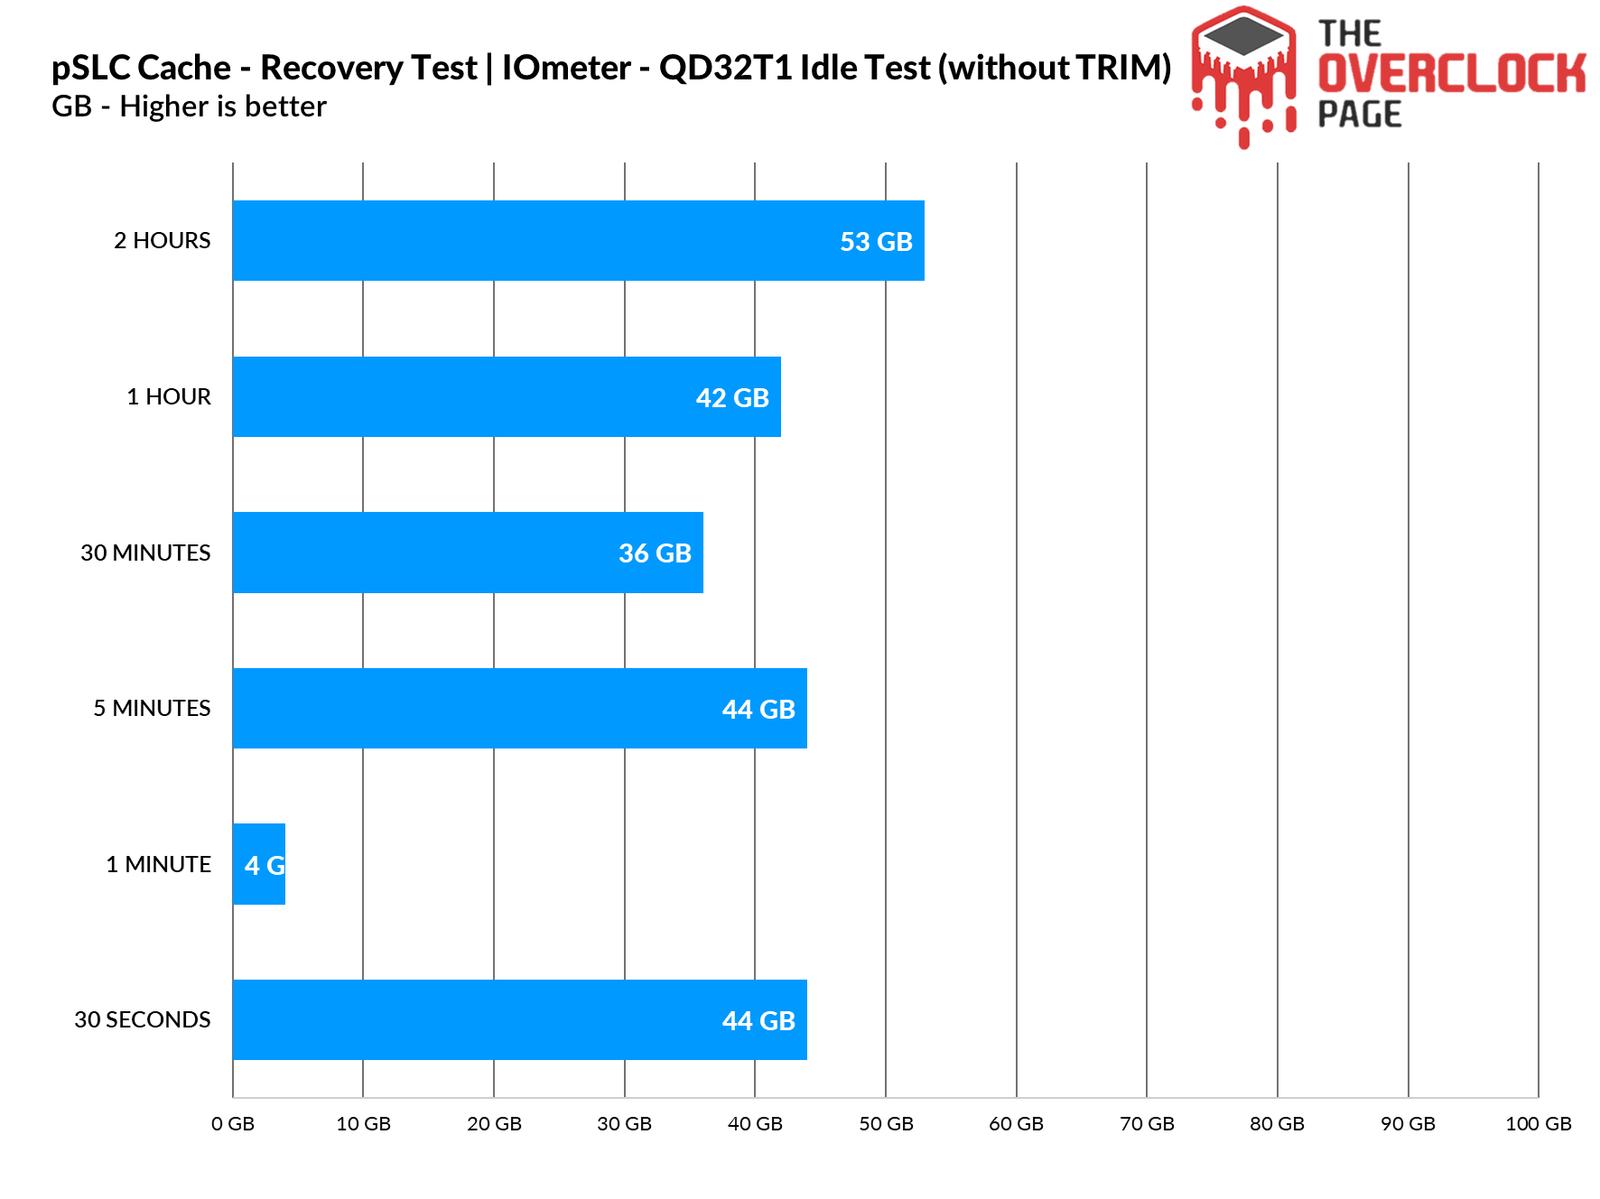
We also conducted a test to see how long the SSD would take to recover part of its buffer during our test suite, which ranges from 30 seconds to 2 hours of idle time, comparing TRIM and garbage collection versus not using them. When testing without TRIM/GC enabled, we observed that it managed to recover about 44GB in just 30 seconds at idle.
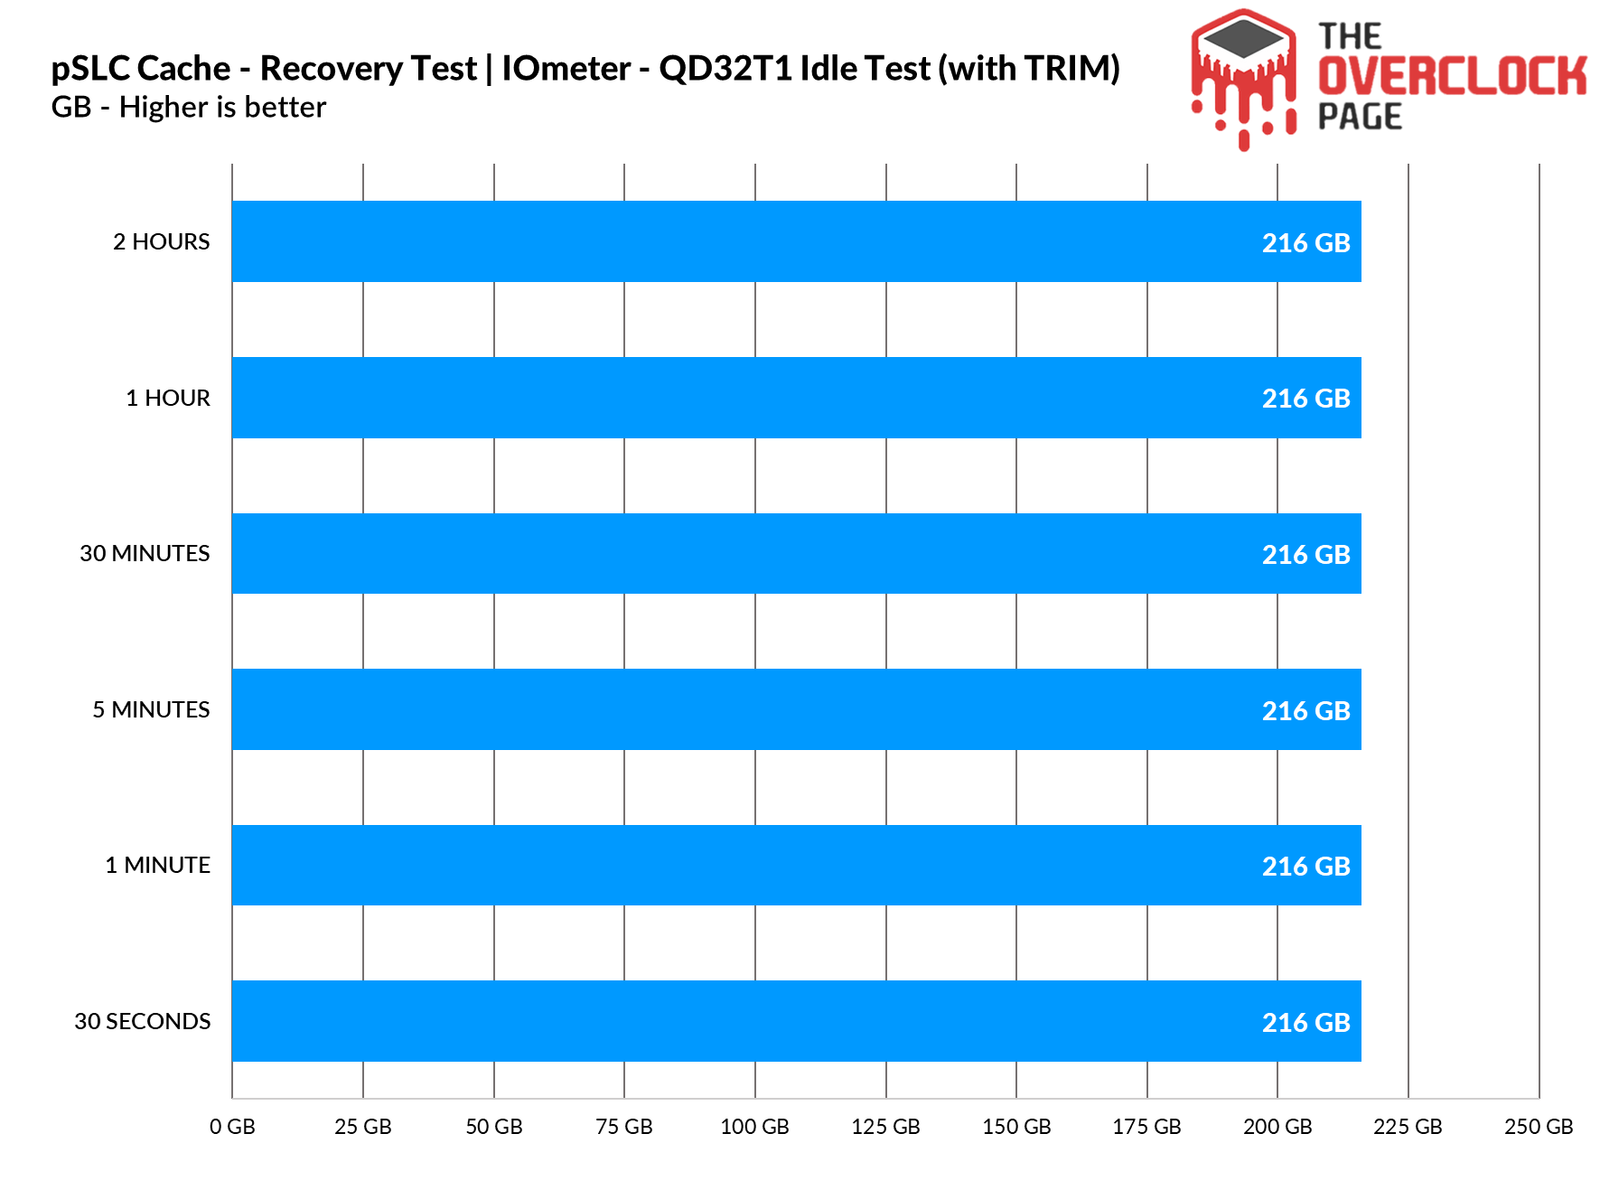
With TRIM/GC enabled, however, it recovers 216GB in just a few seconds.
FILE COPY TEST
In this test, we copied the ISO files and CSGO from a RAM Disk to the SSD to see how it performs. We used the 6.25GB Windows 10 21H1 ISO (a single file) along with the 25.2GB CSGO installation folder.
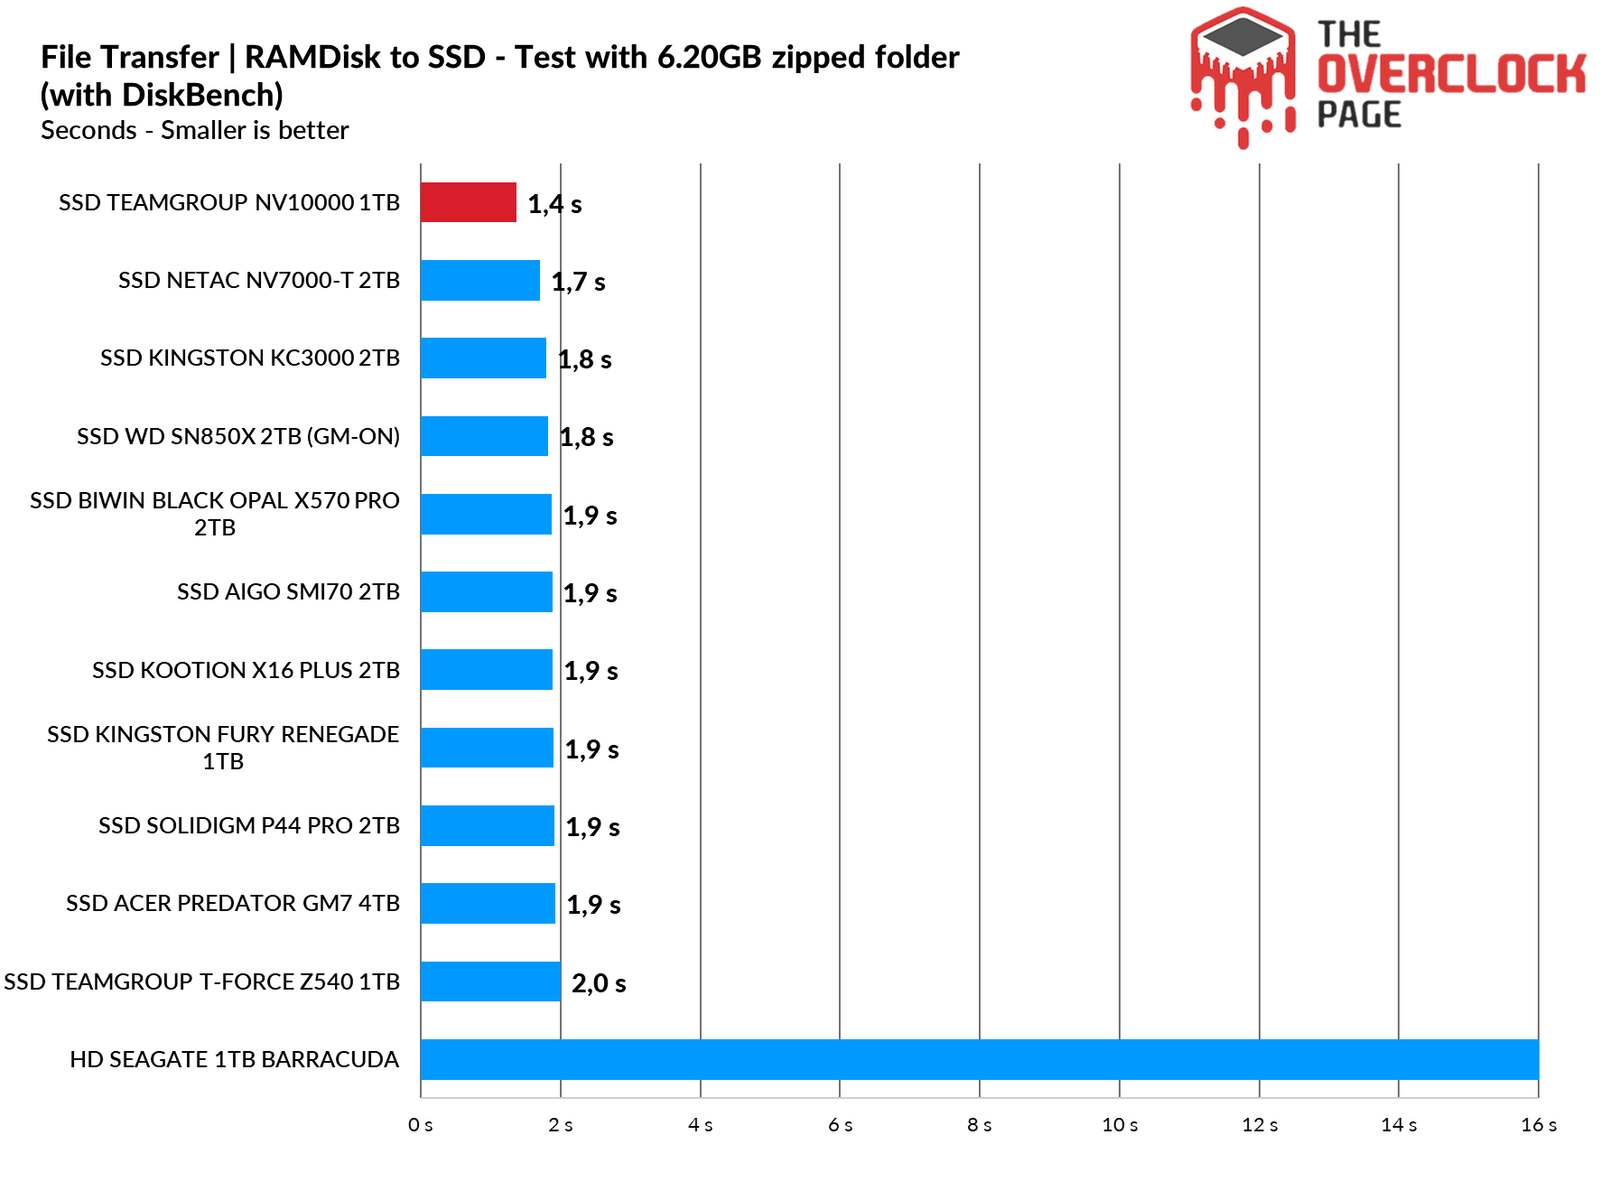
When we used the zipped folder, the NV10000 truly shone and finished at the top of the comparison.
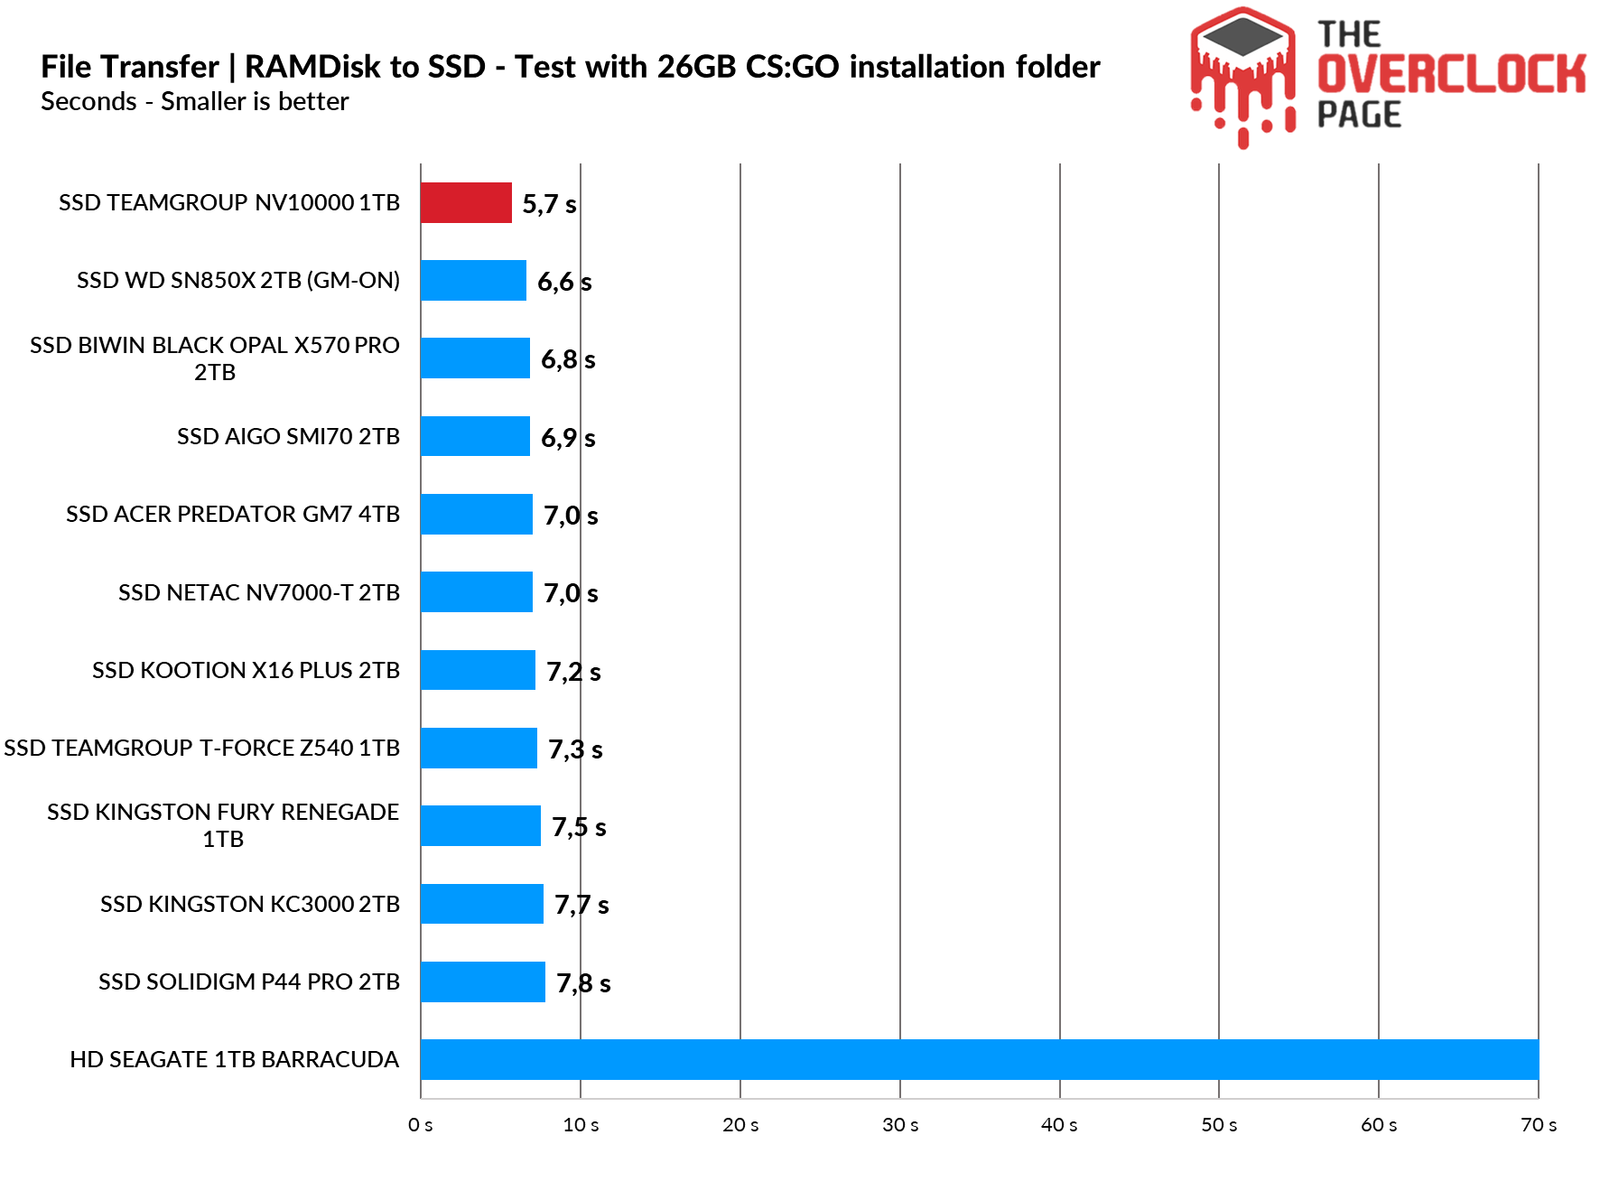
When performing this same test with a much larger folder, the result remained consistent, with the NV10000 staying at the top.
TEMPERATURE
In this section of the review, we will observe the SSD’s temperature during a stress test, where it receives files continuously to determine if any thermal throttling occurred within its internal components that could cause a bottleneck or a loss in performance.
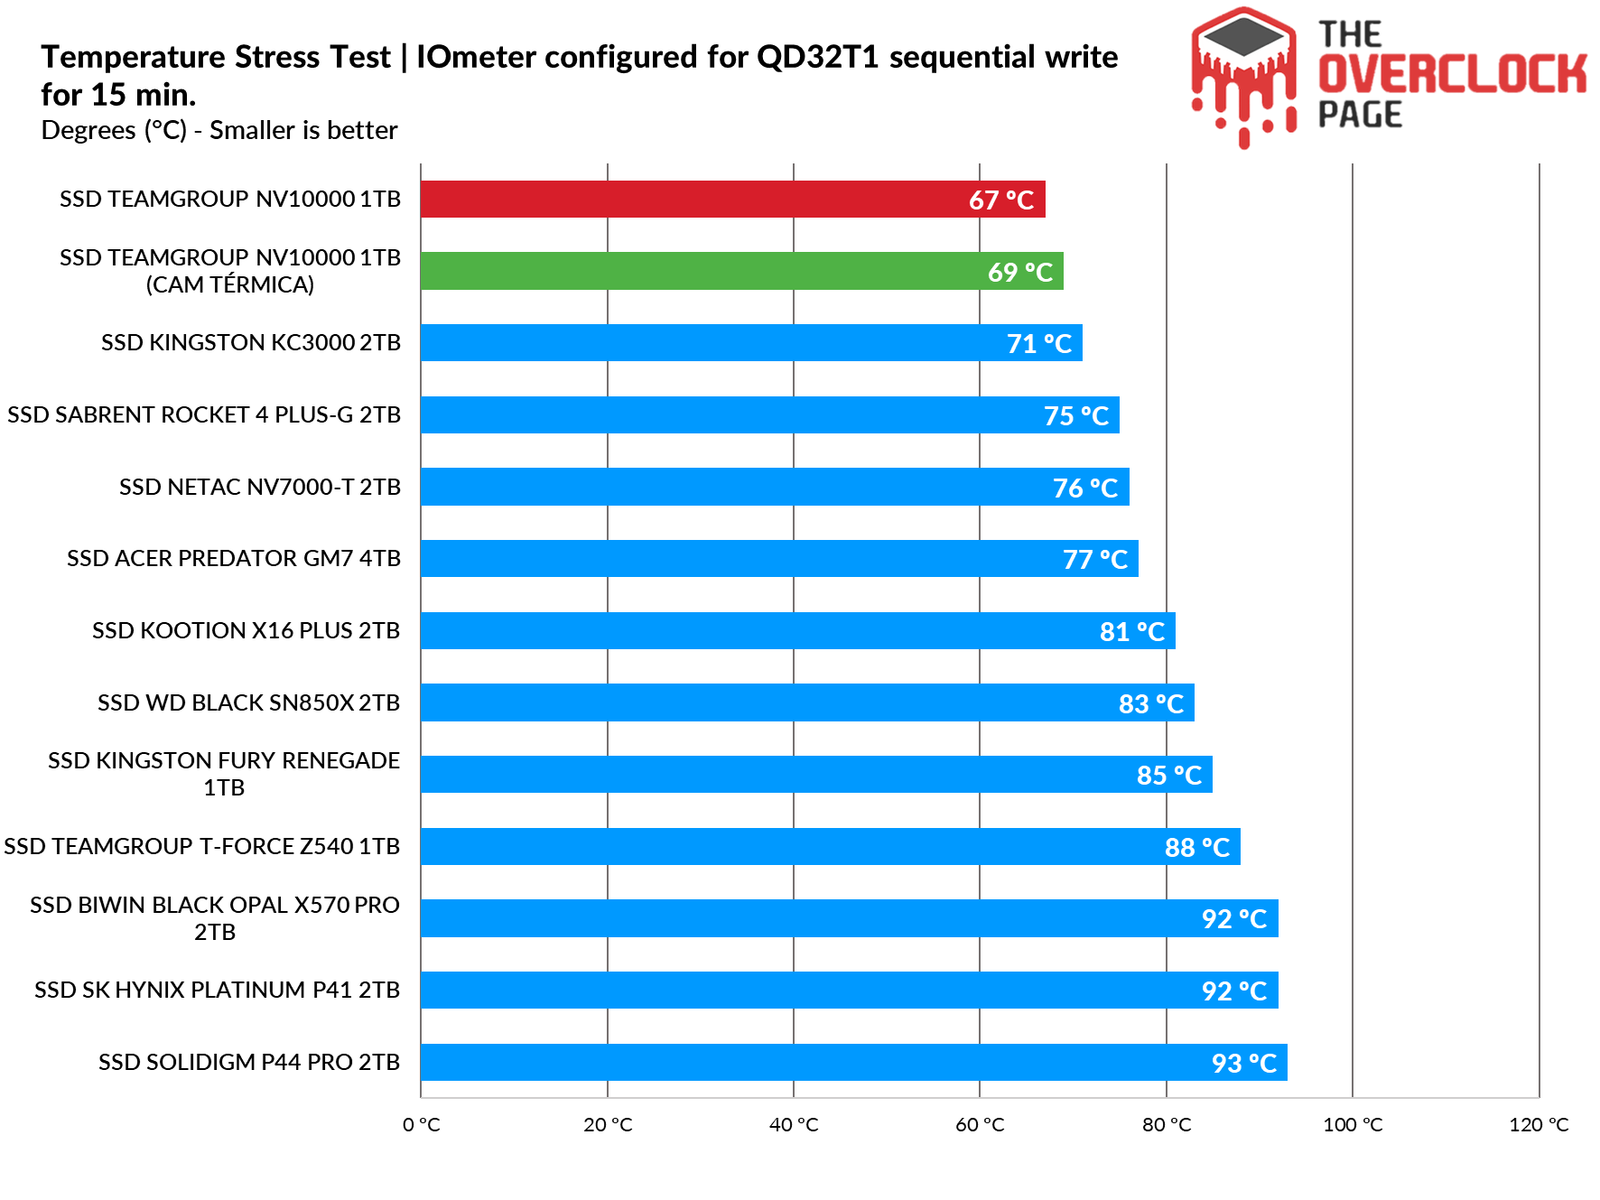
As seen above, this SSD has a default thermal limit of 80°C. It performed well and did not exceed the 67°C measured by its sensor, which indicates that there is a reasonable amount of thermal headroom, even without needing to use any heatsinks.
EFFIENCY AND POWER CONSUMPTION
Just like many other system components, SSDs have specific power consumption levels. The most efficient drives are able to perform requested tasks quickly with relatively low power usage, allowing them to return to their idle power states more rapidly, where energy consumption tends to be lower.
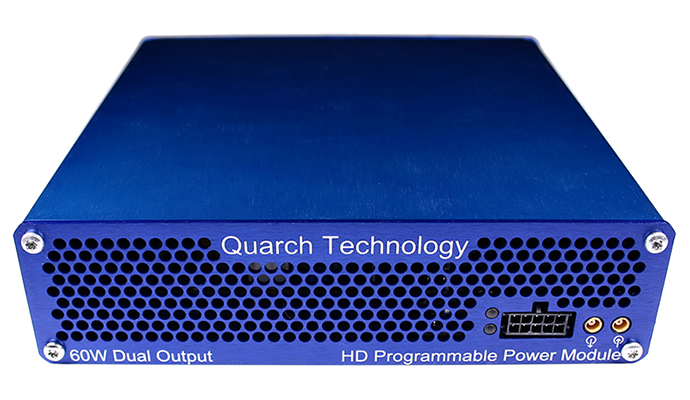
In this section of the review, we will use the Quarch Programmable Power Module that Quarch Solutions sent us (photo above) to conduct these tests and check how efficient the SSD is. This methodology involves three tests: the maximum consumption of the SSD, an average in practical and casual scenarios, and idle usage.
This test suite, especially the efficiency and idle tests, is particularly important for users planning to use drives in laptops, as SSDs spend the overwhelming majority of their time in low-power states (Idle), so this significantly helps save battery life.
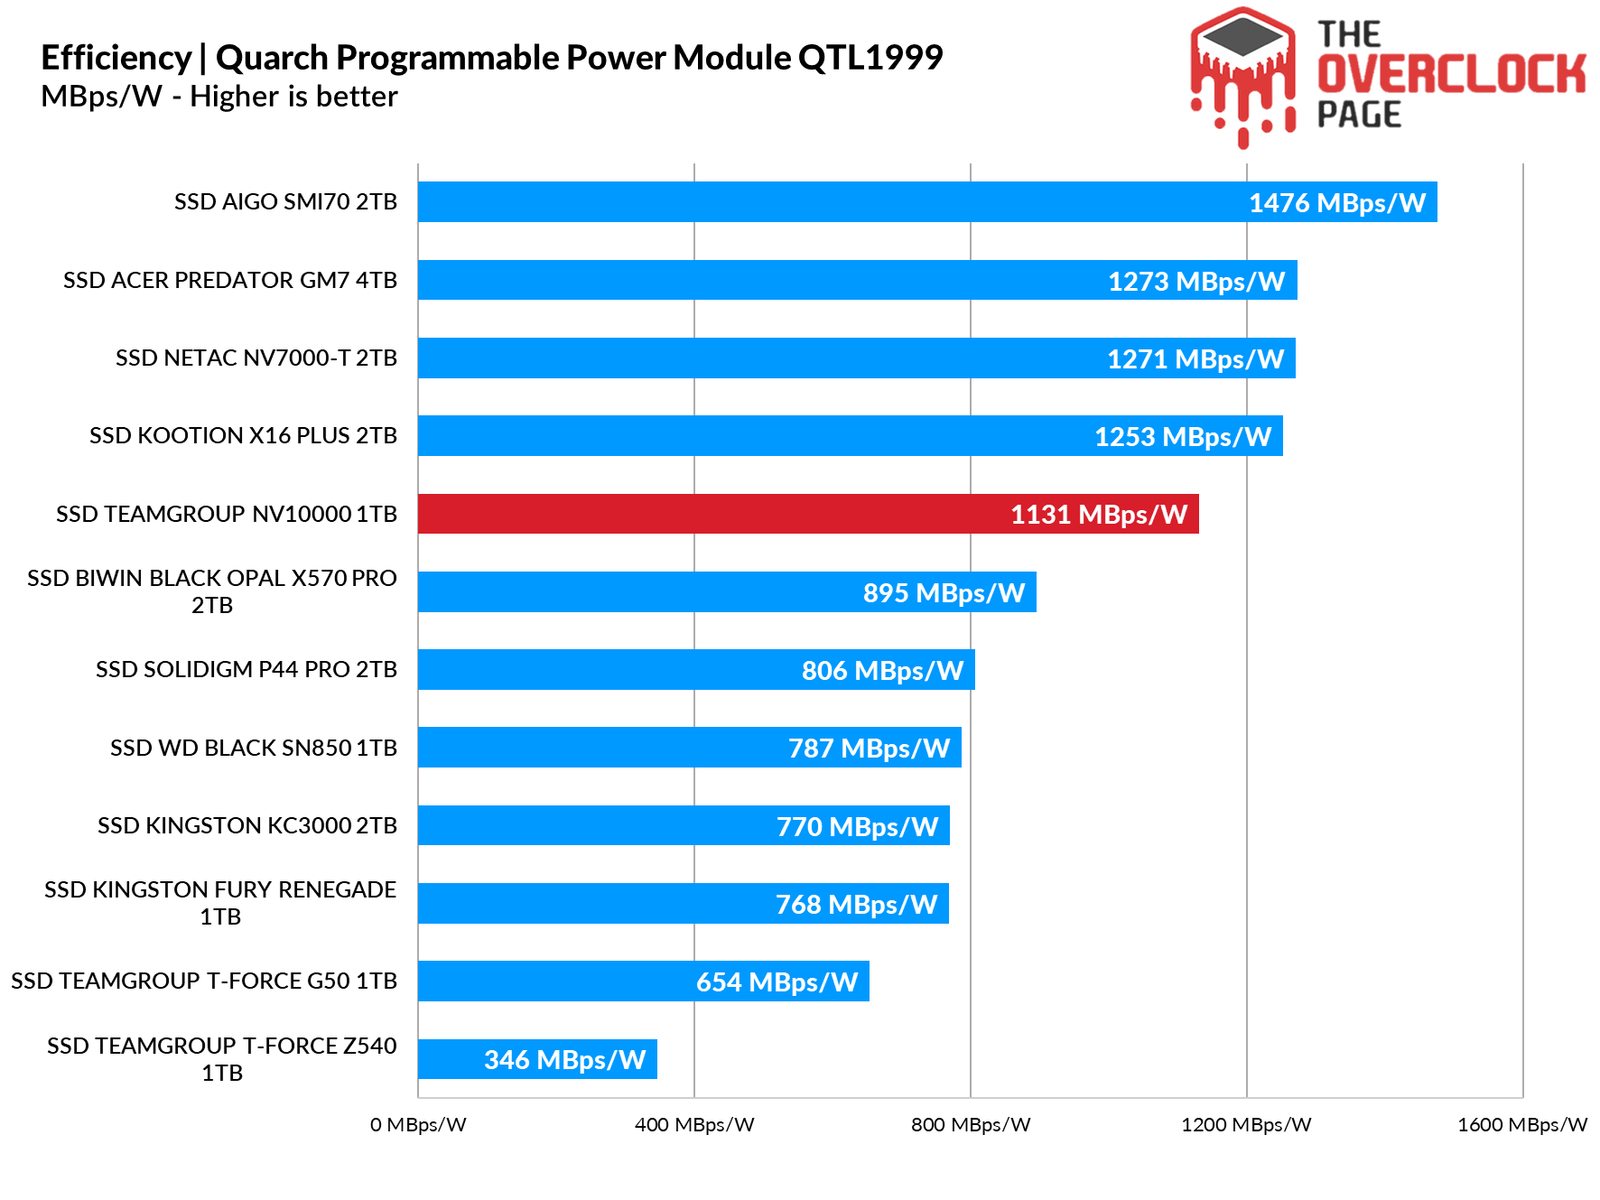
The SSD managed to achieve a pretty decent level of efficiency, surpassing the other Gen5 models we tested previously by a significant margin.
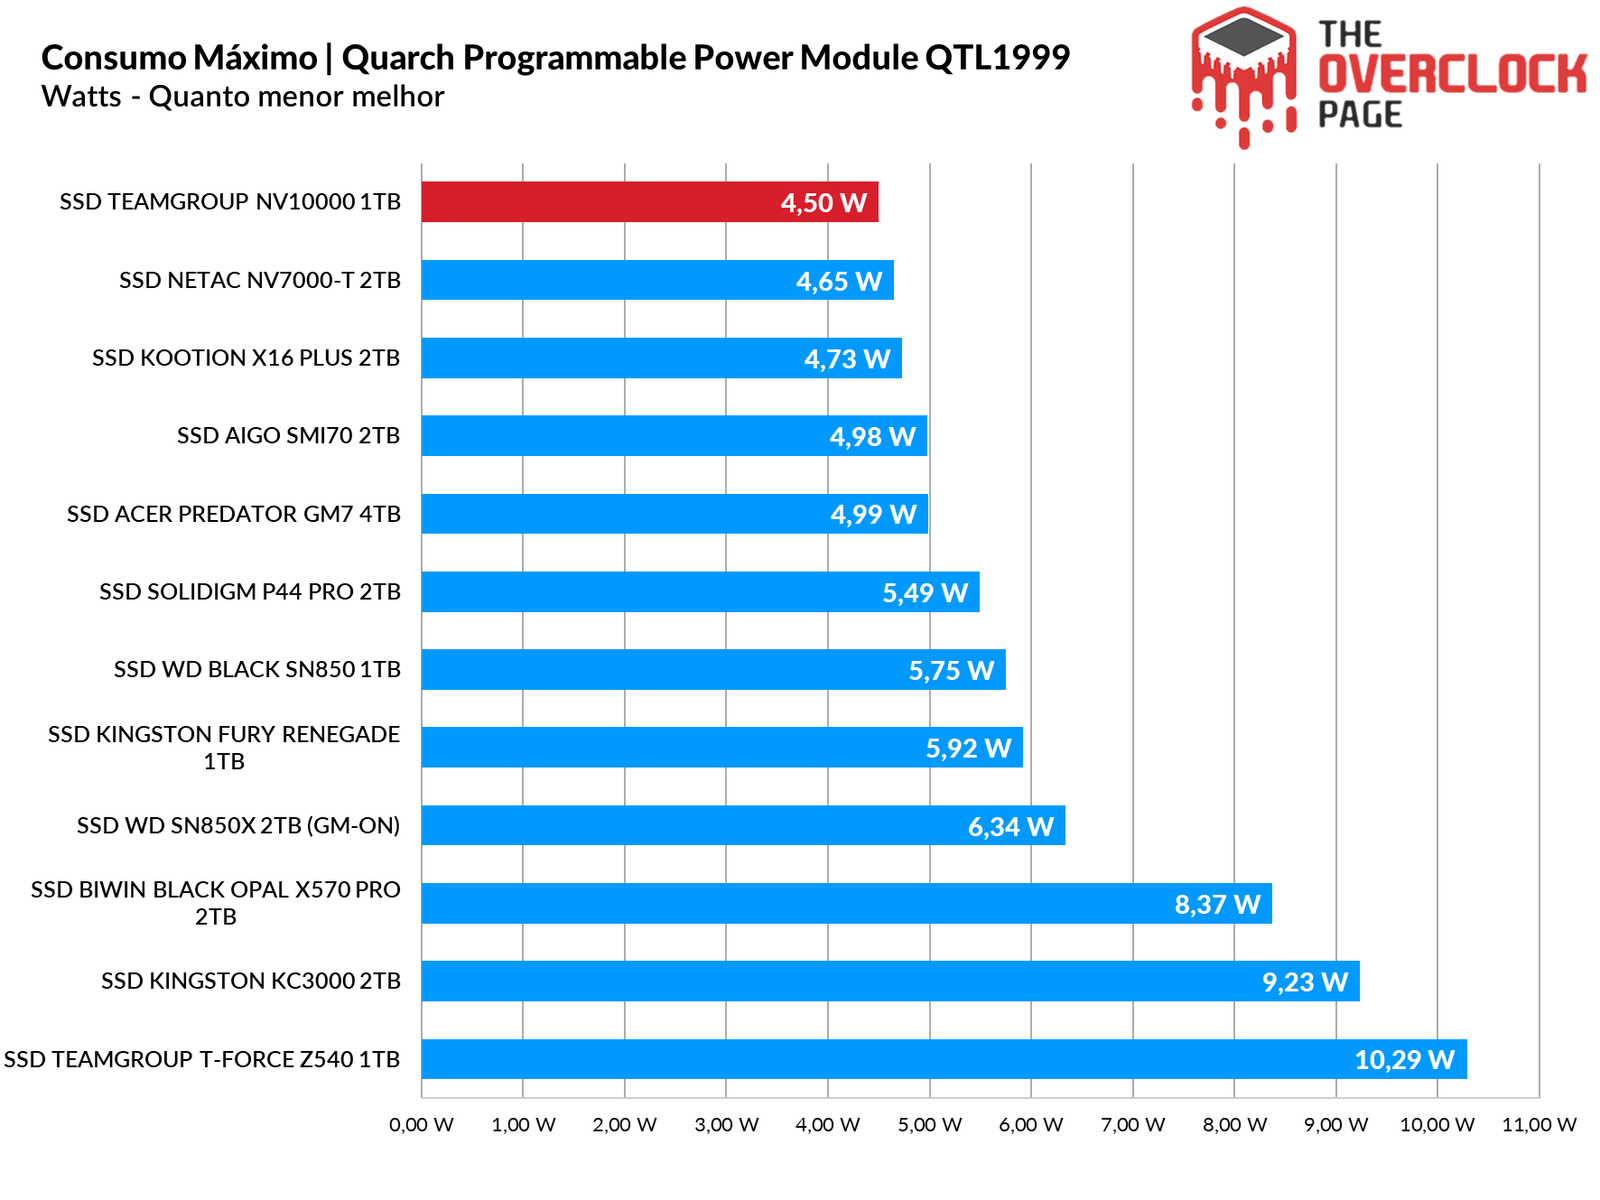
Regarding its maximum power consumption, it achieved an exceptional result of approximately 4.5W.
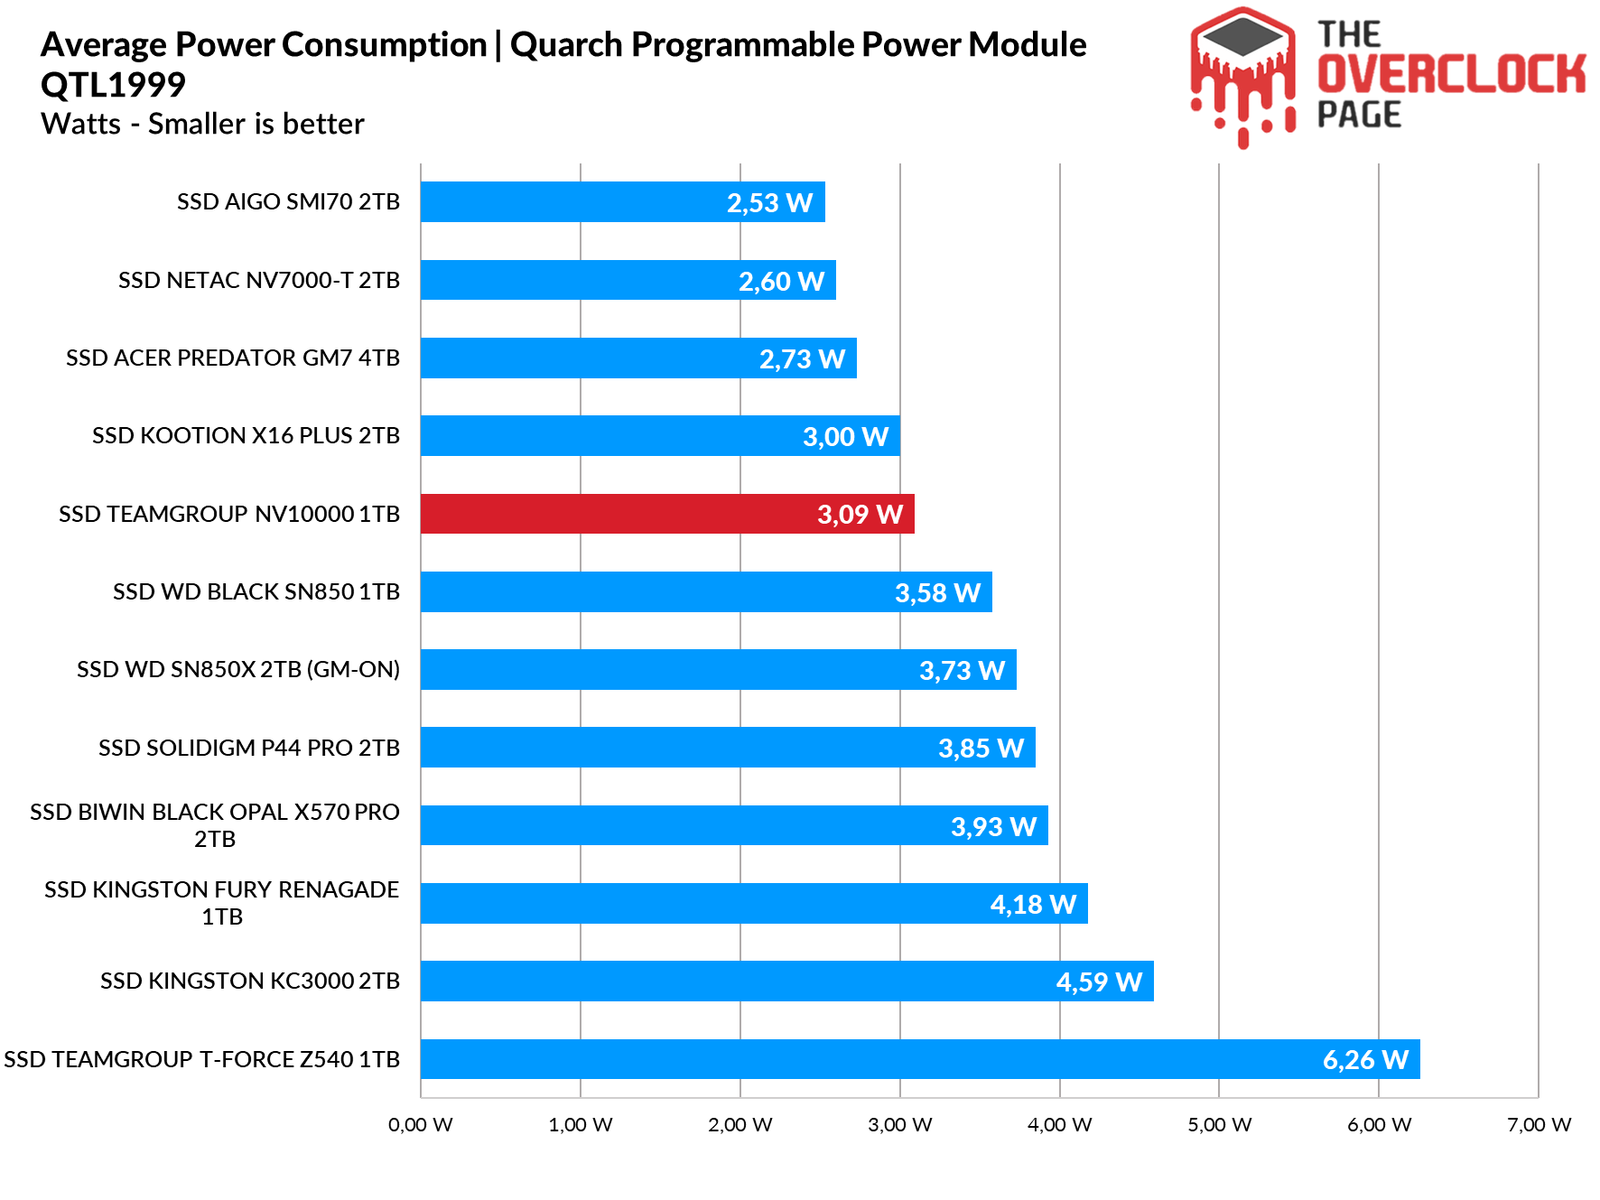
On average, its power consumption was quite reasonable, once again comfortably outperforming the other Gen5 models.
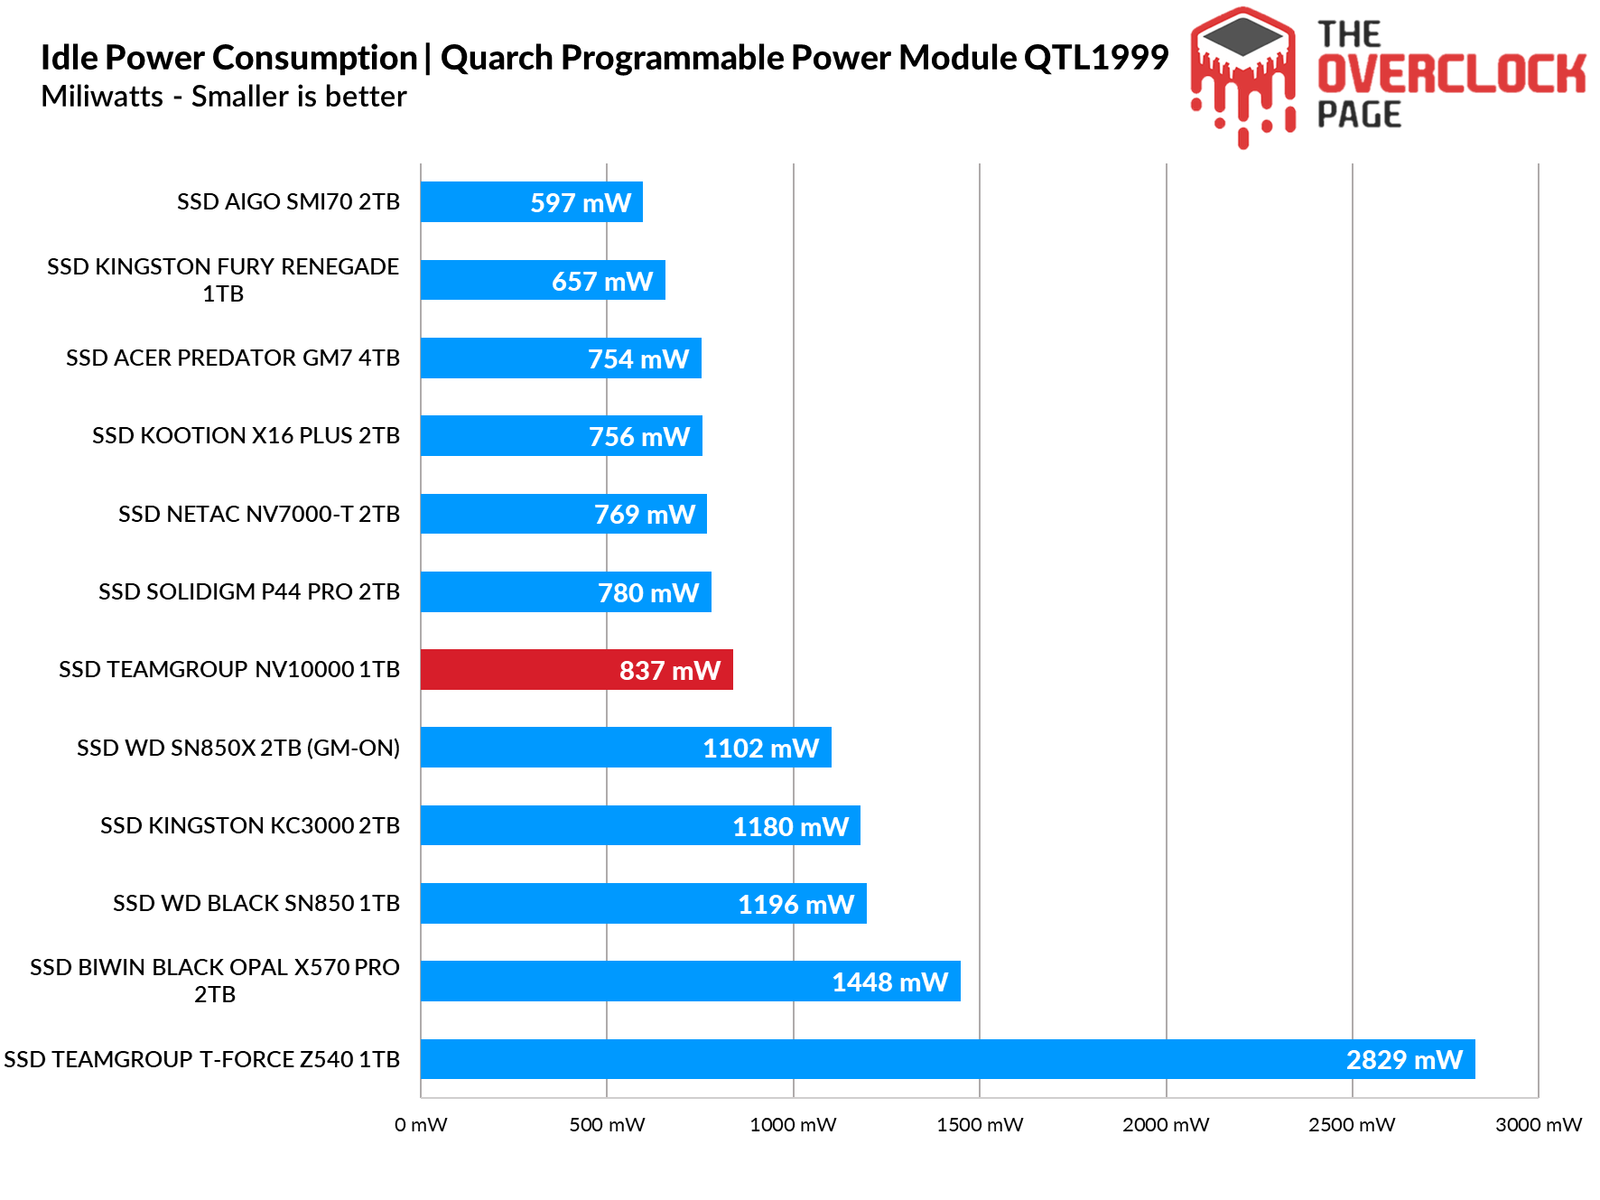
Finally and most importantly, there is the idle test, which is the scenario where the overwhelming majority of SSDs reside during everyday use, and even here it doesn’t disappoint, as it achieved a solid result of 837mW.
Conclusion
Considering all of this, is it really worth investing in this SSD?
The SSD delivers very good performance and addresses one of the biggest issues with Gen5 models, which is high power consumption and heat dissipation. The most sensitive point is the price, as at the R$1,700 asking price, it’s possible to find similar Gen5 models for even less than R$1,500 during sales.
PROS
Decent sequential speeds that align with manufacturer claims
Good performance in practical and professional scenarios
Features a solid combination of controller and TLC dies
Does not require a heatsink to maintain safe temperatures
Low power consumption
Excellent energy efficiency
CONS
Lacks encryption support
Price is slightly above expectations