The impact of SLC Cache in performance of an NVMe SSD – Benchmarks and Results!
In this article, we’ll do something unprecedented! We’ll demonstrate the real difference that SLC Cache makes in an NVMe SSD. To achieve this, we’ll use Mass Production Tools (MPTools), which allow us to disable the pSLC Cache of an SSD, forcing it to operate in its native TLC or QLC mode.
Specifications of the Subject SSD
The chosen SSD was a Pichau Aldrin Pro 2TB, which we tested a few months ago. It was provided by Pichau for a review and now for this article.
BEWARE BEFORE PROCEDING WITH THE CONTENT!!!
This is not a tutorial; after all, it voids the warranty, affects the SSD’s performance, and is intended solely as educational content.
In addition to voiding the warranty, WHEN WRITING THE FIRMWARE TO THE SSD, ALL DATA IS ERASED, so be sure to back up your devices beforehand.
NECESSARY TOOLS
To perform this procedure, it was necessary to use a SATA to USB 3.0 adapter with a Jmicron Bridge Chip, model JMS578.
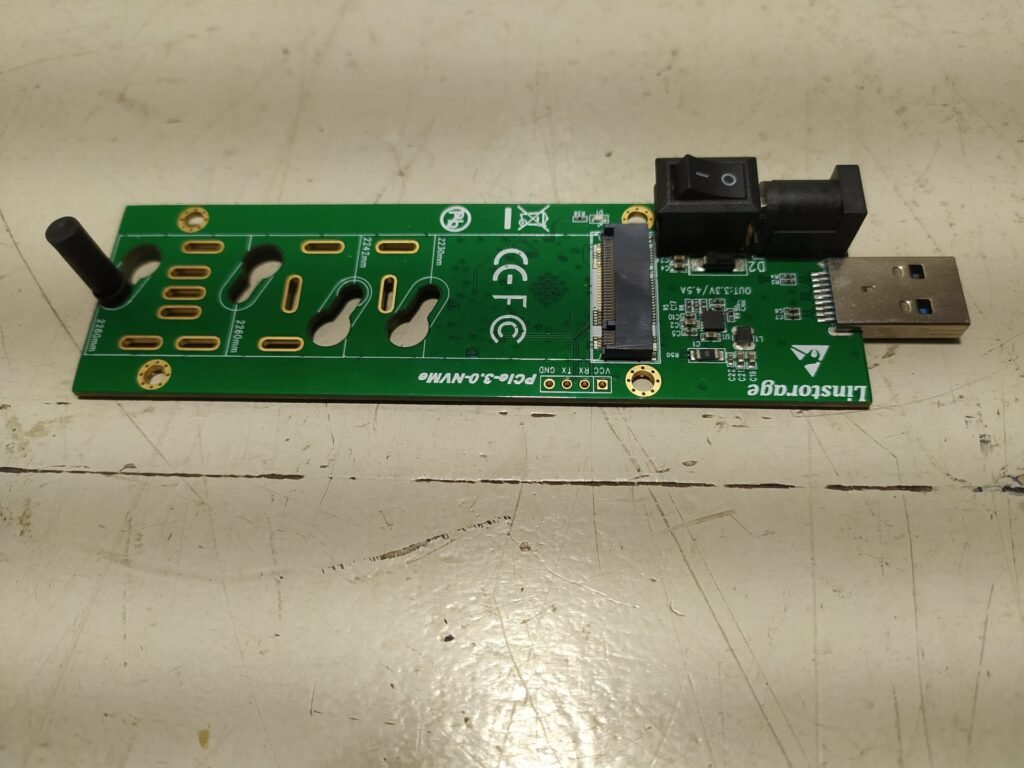

In addition to tweezers to short the terminals of the ROM/Safe Mode on the SSD’s PCB.
Technical Specifications
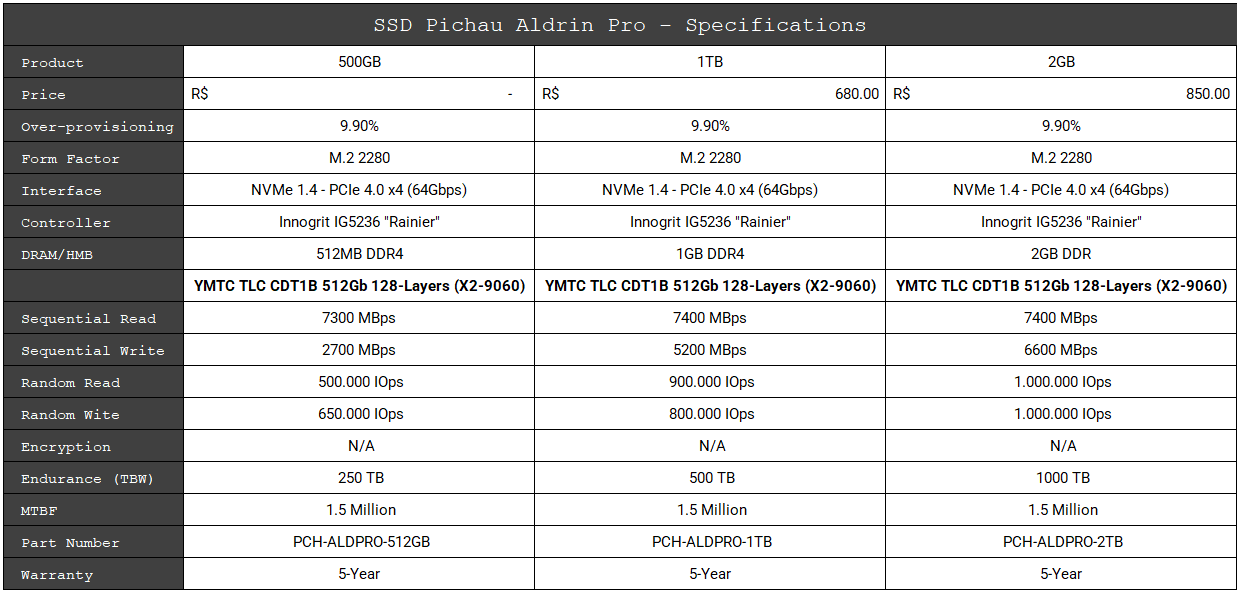
Before we proceed with the process, let’s take a closer look at this SSD.
Controller
The SSD controller is responsible for managing all data, over provisioning, and garbage collection, among other background functions. Naturally, this ensures that the SSD performs well.
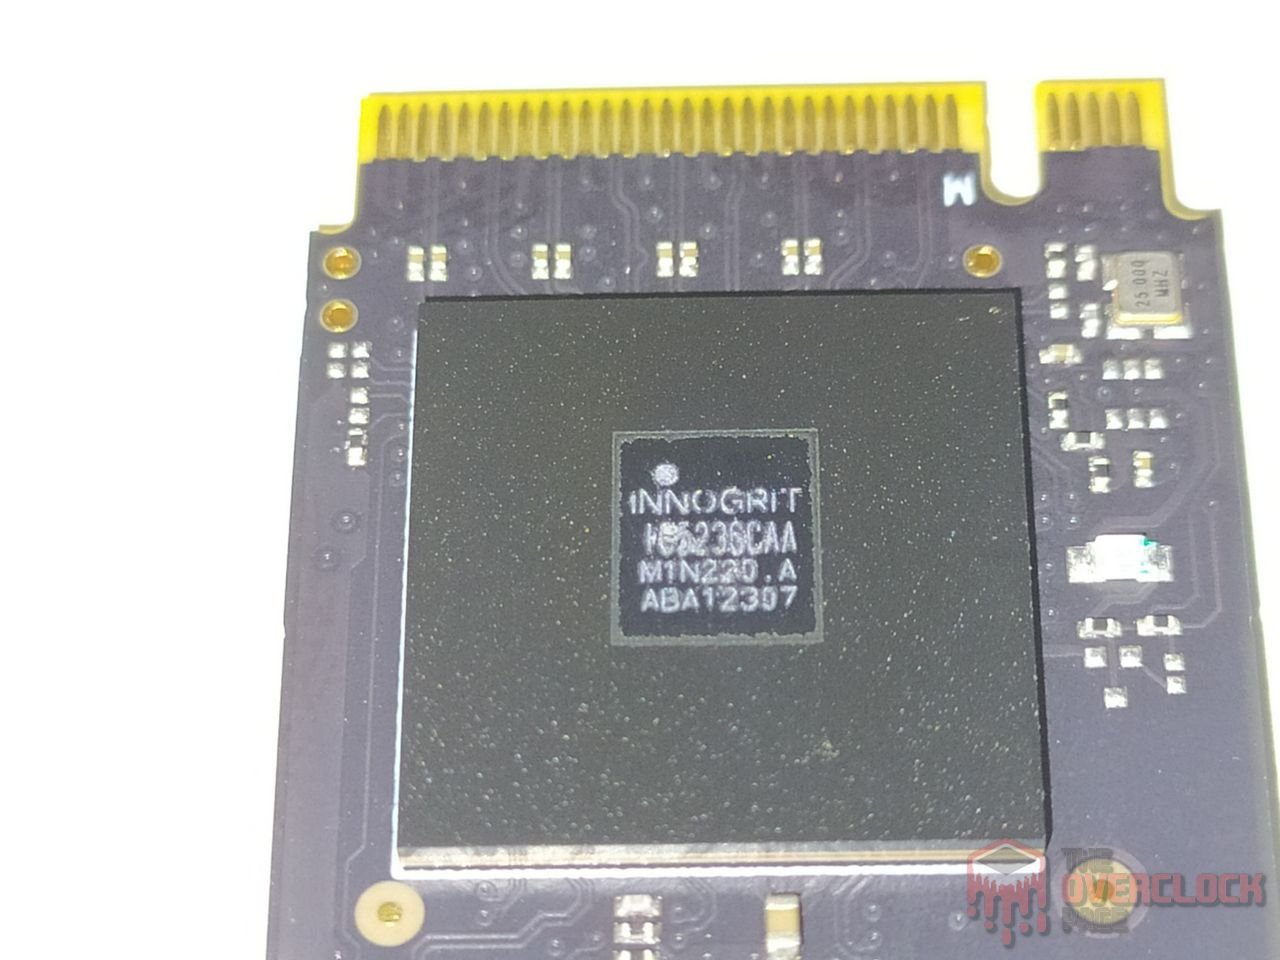
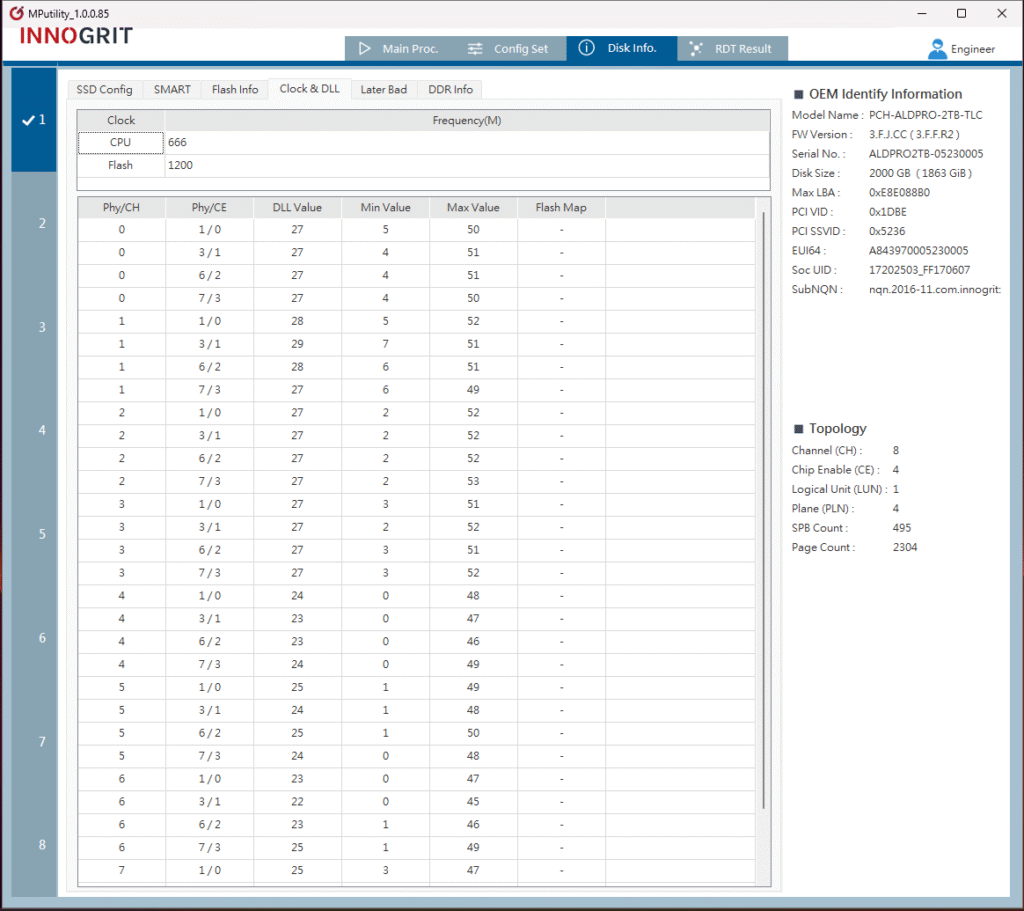
This SSD uses a high-end controller from Innogrit: the IG5236, an ISA ARM 32-bit quad-core Cortex® R5 model, manufactured using TSMC’s 12nm FinFET CMOS process, similar to the traditional Phison E18. Its four main cores operate at a clock speed of 667 MHz, while, by comparison, the Phison E18’s three cores run at 1 GHz, with two additional cores running at a much lower frequency. This controller is found in various high-end SSDs, such as the XPG Gammix S70, S70 Blade, Asgard AN4, among many other models.
In this case, it’s a controller with 8 channels, supporting a bus of up to ONFI 4.1 or Toggle 2.0/3.0/4.0, allowing for a bus speed of up to 1200 MT/s. Each channel supports interleaving with up to 4 Chip Enable connections, which is a command and a physically connected path from each die to the controller. This configuration allows it to communicate with a maximum of 4 dies per channel, for a total of up to 32 dies, ensuring maximum performance.
It also supports DRAM Cache types such as DDR3L/DDR4, DR3L/4, LPDDR3/LPDDR4, and for various encryption methods like AES, RSA, and SHA.
In summary, it doesn’t differ much from the E18, with one of the main differences being the bus speed, aside from the number of cores. The Phison E18 supports up to 1600 MT/s, while this controller operates at up to 1200 MT/s. However, to reach 1600 MT/s, the dies also need to support this speed, and even then, the serial gain is almost imperceptible in most scenarios.
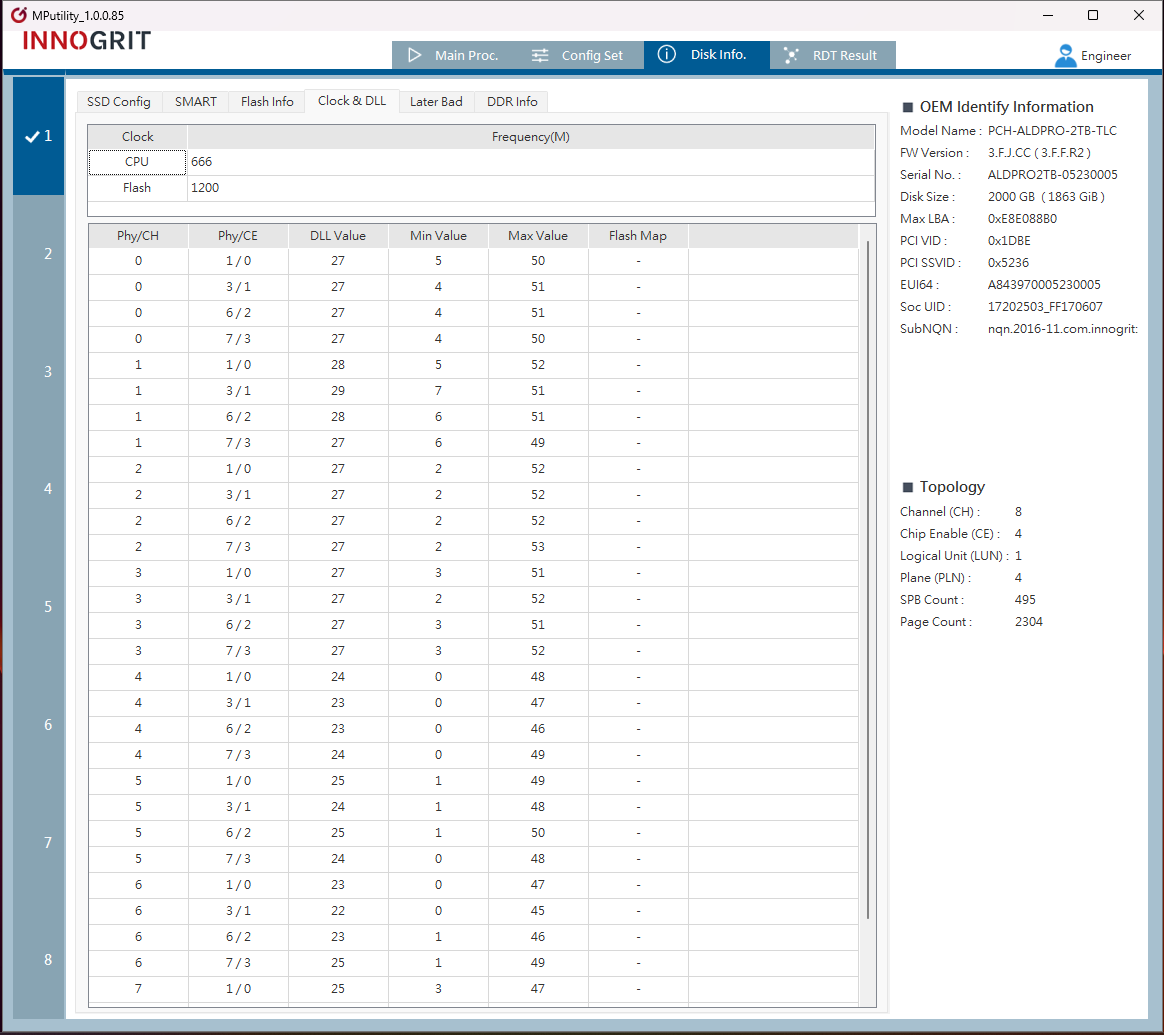
In the image above we can clearly see, the tools show us the Controller, “CPU“, speed.
DRAM Cache or H.M.B.
Every high-end SSD aiming to provide consistent high performance needs a buffer to store its mapping tables (Flash Translation Layer or Look-up table). This allows it to achieve better random performance and be more responsive.
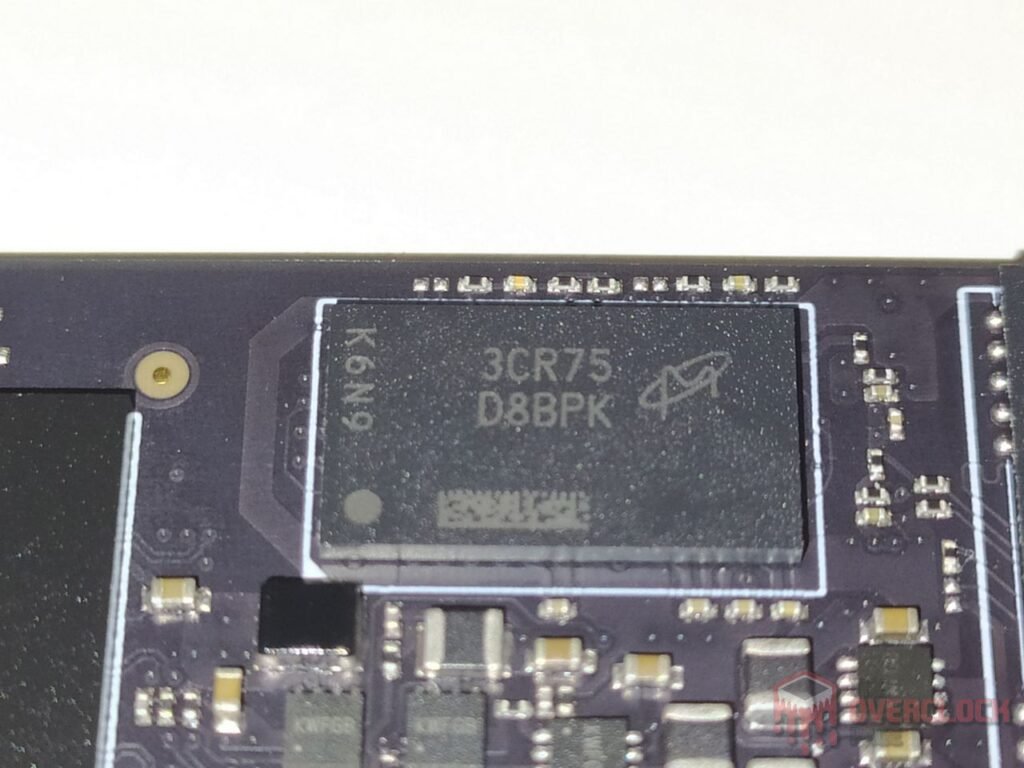
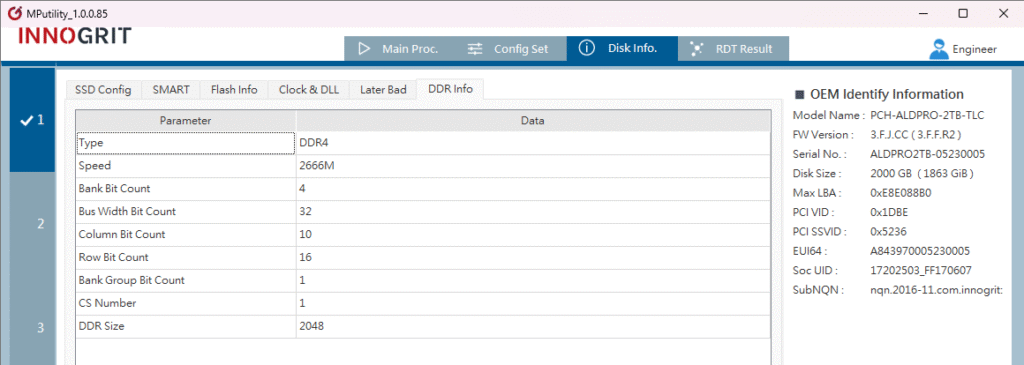
We observed that this SSD uses two DRAM Cache modules from Micron, model D8BPK. By using the manufacturer’s decoder, we identified them as “MT40A512M16TB-062E” with each DRAM Cache having a density of 8Gb (1GB), totaling 2GB of DDR4-3200 MT/s CL22. However, they operate at 2666 MT/s due to the internal memory controller limitation in the Innogrit.
NAND Flash
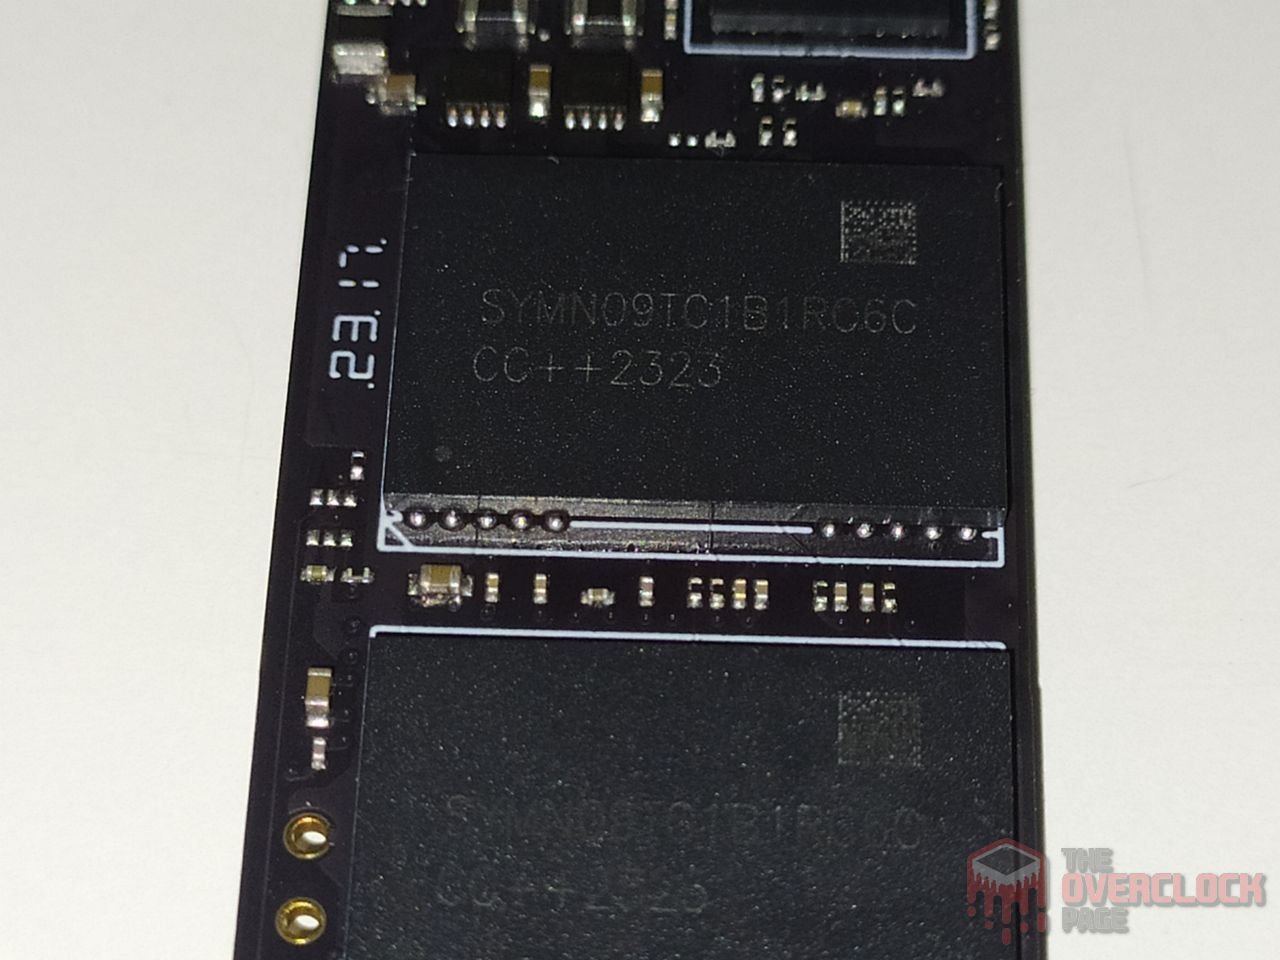
Regarding its NAND Flash, the 2TB SSD has four NAND flash chips labeled ‘SYMN09TC1B1RC6C.’ These NANDs are from the Chinese manufacturer YMTC, model CDT1B, with 512Gb (64GB) dies containing 128 layers of data and a total of 141 gates, resulting in an array efficiency of 90.7%. Of the 141 layers in the SSD, 128 are allocated for storage, contributing to this efficiency.
In this SSD, each NAND Flash chip contains 8 dies, each with a density of 512Gb, totaling 512GB per NAND, which together make up the 2TB capacity. They communicate with the controller at their maximum bus speed of 1200 MT/s for optimal performance.
Each die has 4 planes, enabling the controller to increase parallelism when accessing each die, thereby enhancing performance. It’s important to note that there are two models of YMTC 128-layer dies: those released earlier, known as CDT1B, which also have 4 planes, as shown in the following photo.
We can observe in the images above that the SSD indeed operates with its NANDs at a speed of 1200 MT/s, which is the limit of the controller.
SOFTWARES USED IN THE PROJECT
After a long search, we finally gained access to the Innogrit IG5236 Rainier Mass Production Tool, the software I mentioned in the article about the Problem of MN-5236.
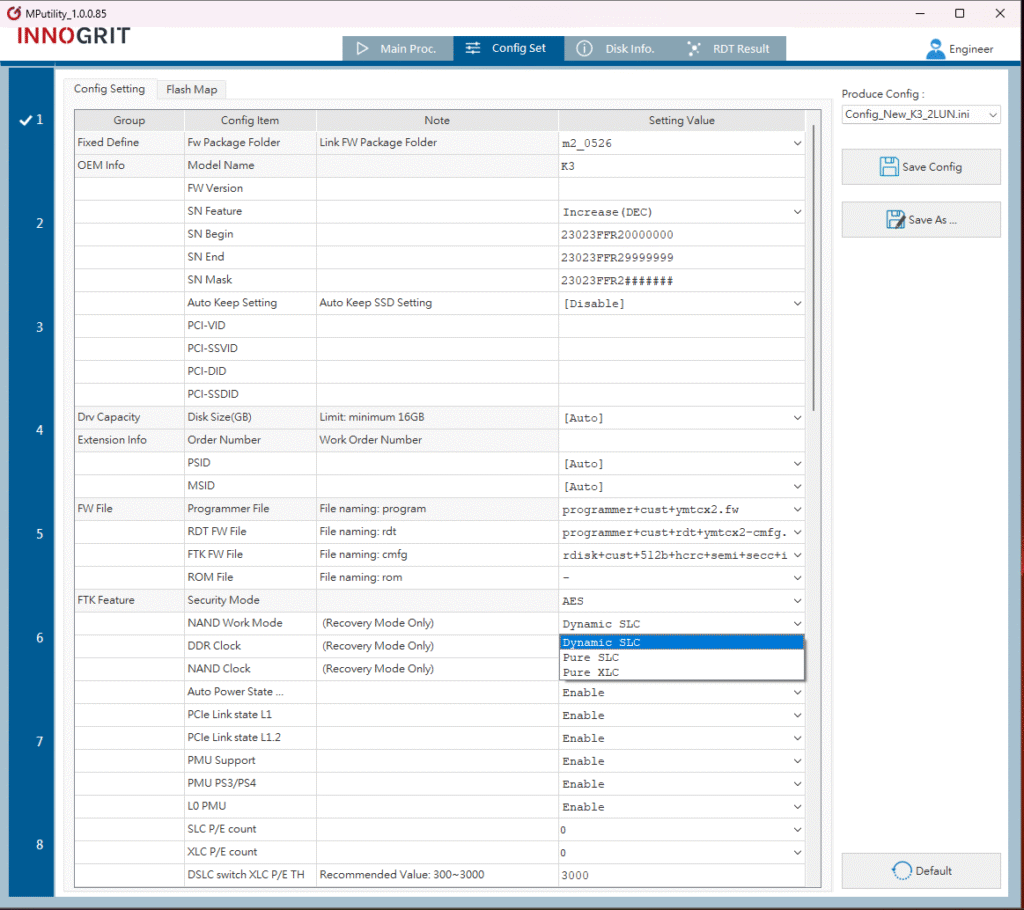
It is through this tool that the necessary modifications were made to disable the pSLC Cache of the SSD, as shown in the image below.
By selecting ‘Pure XLC,’ the ‘X’ represents the NAND in its native form, such as native TLC, MLC, or QLC. The Dynamic SLC mode is how it comes from the factory with this version of the firmware.
In this configuration, the SSD’s SLC Cache is set to its maximum size, meaning that if the SSD has 2TB (2000GB), it will allocate approximately 660GB to 700GB as pSLC Cache. It’s possible to program a smaller SLC Cache or even a hybrid or static system; however, this would require a different .bin firmware file.
We also have the ‘Pure SLC’ mode, which is quite interesting because, unlike Dynamic SLC, it converts the entire SSD into pseudo-SLC. In this way, instead of the SSD having its normal size of 2TB with 660GB of SLC Cache, it would have only 640GB of pSLC. In this mode, the SSD never enters native write or folding mode, which significantly reduces the SSD’s performance, especially as it becomes fuller.
TESTING BENCH
– OS: Windows 11 Pro 64-bit (Build: 23H2)
– CPU: Intel Core i7 13700K (5.7GHz all core) (E-cores e Hyper-threading desabled)
– RAM: 2 × 16 GB DDR4-3200MHz CL-16 Netac (c/ XMP)
– Motherboard: MSI Z790-P PRO WIFI D4 (Bios Ver.: 7E06v18)
– GPU: RTX 4070 Ti Super Colorful (Drivers: 555.xx)
– (OS Drive): SSD Solidigm P44 Pro 2TB (Firmware: 001C)
– DUT SSD: SSD Pichau Aldrin Pro 2TB (Firmware: My custom)
– Chipset Driver Intel Z790: 10.1.19376.8374.
– Windows: Indexing disabled to avoid affecting test results.
– Windows: Windows updates disabled to avoid affecting test results
– Windows: Most Windows applications disabled from running in the background.
– Boot Windows: Clean Image with only Drivers
– Test pSLC Cache: The SSD is cooled by fans to prevent thermal throttling, ensuring it doesn’t interfere with the test results.
– Windows: Antivirus disabled to minimize variation in each round.
– DUT SSDs: Used as a secondary drive, with 0% of space being utilized, and other tests conducted with 50% of space utilized to represent a realistic scenario.
– Quarch PPM QTL1999 – Power consumption test: conducted with three parameters—idle, where the drive is left as a secondary, and after a period of idle, a one-hour write test is performed, and the average power consumption is recorded
CONTRIBUTIONS FOR FUTURE PROJECTS
If you enjoyed this article and would like to see more content like this, I’m providing a link below where you can contribute directly
Patreon Support – Gabriel Ferraz
SUSTAINED WRITE SPEEDS | SLC CACHING
A significant portion of SSDs on the market today relies on SLC Caching technology, where a certain percentage of the storage capacity—whether it’s MLC (2 bits per cell), TLC (3 bits per cell), or QLC (4 bits per cell)—is used to store only 1 bit per cell. This acts as a write and read buffer, where the controller starts writing, and when the buffer is exhausted, it writes to the native NAND Flash (MLC / TLC / QLC)
We usually start our tests with benchmarks from CDM and others, leaving the SLC Cache tests for later. However, this time we did it differently so you can see that the SSD’s pSLC Cache was indeed disabled
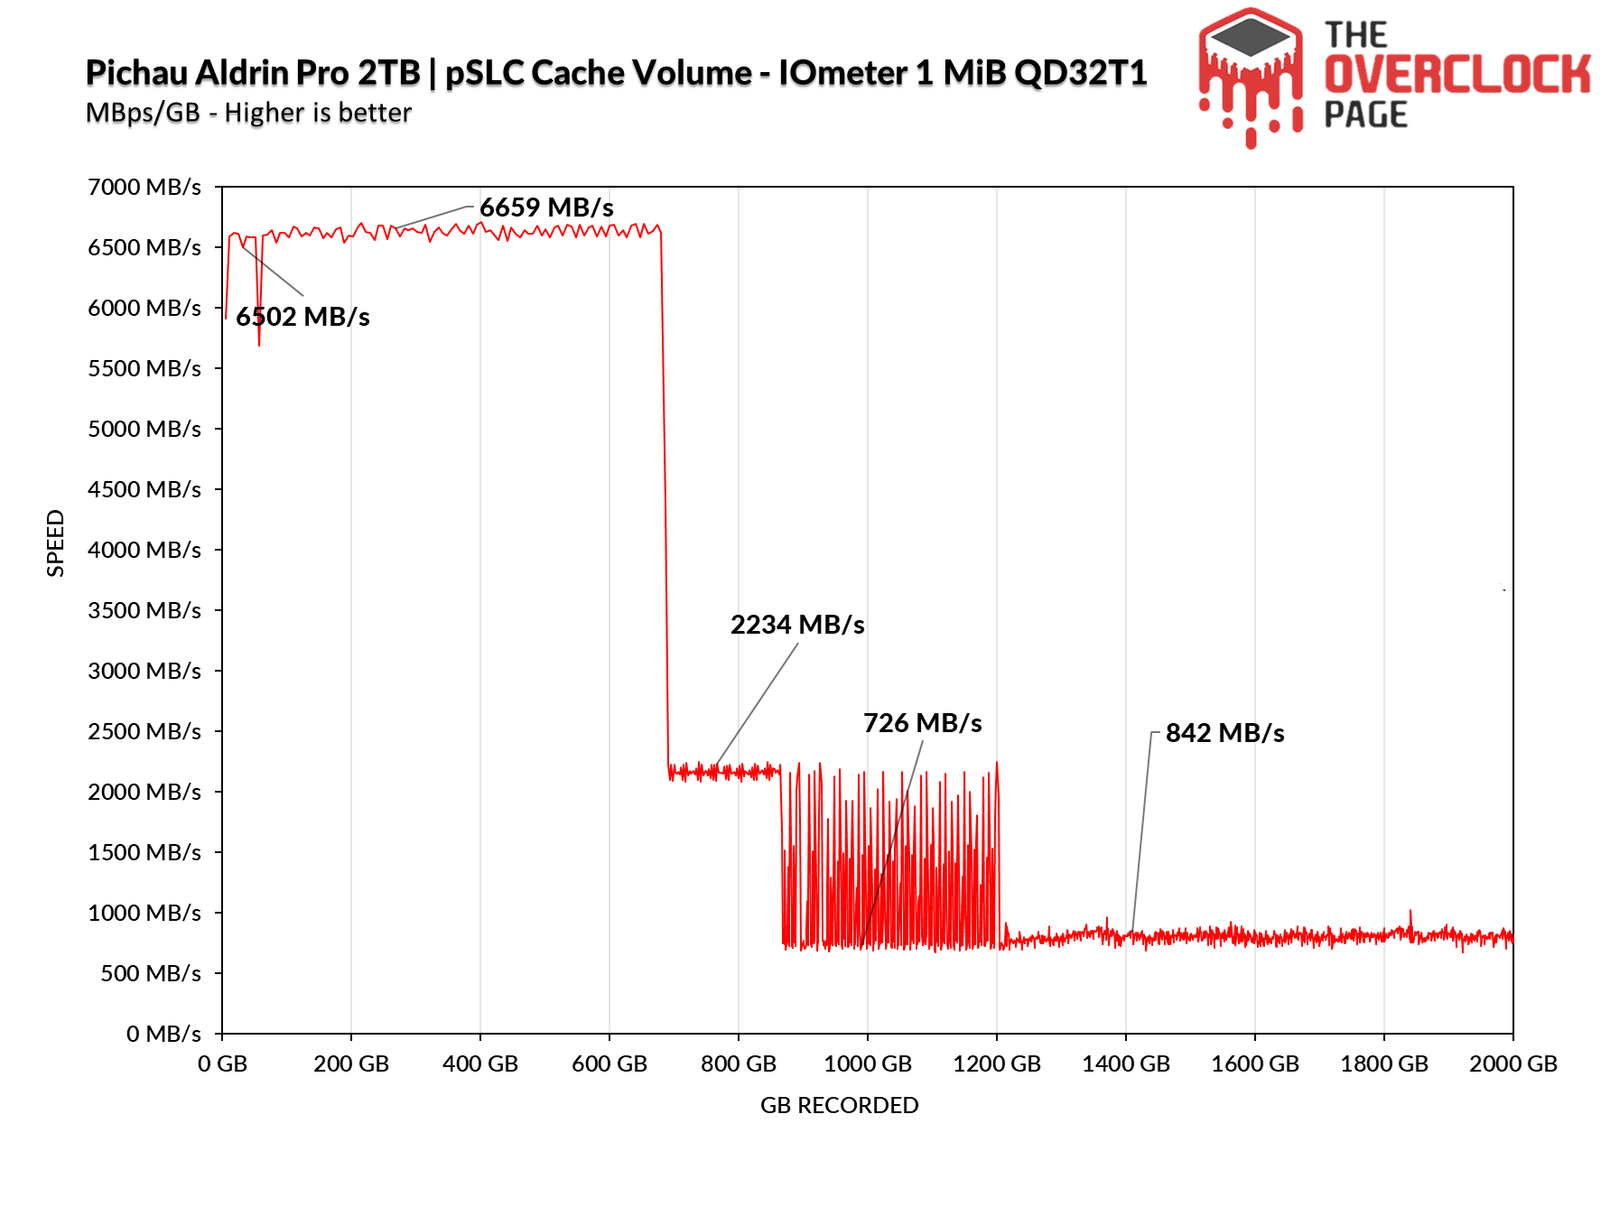
Using IOmeter, we can get an idea of the SLC cache volume of this SSD, as the manufacturer often does not disclose this information. From the tests we conducted, it was evident that it has a dynamic pSLC Cache of approximately 691GB, which is quite large. It managed to maintain an average speed of around 6579MB/s until the buffer was exhausted, which is a good speed considering this is a 2TB PCIe 4.0 SSD with 32 dies.
After writing 691GB, it began writing to the blocks natively programmed as TLC, where its average speed was approximately 2159 MB/s, which is excellent. It maintained this average speed from 693GB to around 868GB, or about 175GB at an average of nearly 2200 MB/s.
After 868GB, it started the folding process, where it reprogrammed the blocks that were in pSLC mode back to TLC, resulting in a significant drop in performance. The SSD maintained an average write speed of 863 MB/s until the unit was full.
With the pSLC Cache disabled, the SSD’s performance has dropped significantly. It will no longer reach speeds of over 6000 MB/s unless we reactivate the SSD’s pSLC Cache.
However, a significant advantage of disabling the pSLC Cache is the consistency in performance. In this case, the SSD maintains a steady and stable speed above 2100 MB/s from the beginning to the end of the test, and it doesn’t drop below this level unless it’s experiencing thermal throttling.
CRYSTALDISKMARK
We conducted synthetic sequential and random tests with the following configurations:
Sequential: 2x 1 GiB (1 MiB Blocks) 8 Queues 1 Thread
Random: 2x 1 GiB (4 KiB Blocks) 1 Queue with 1/2/4/8/16 Threads
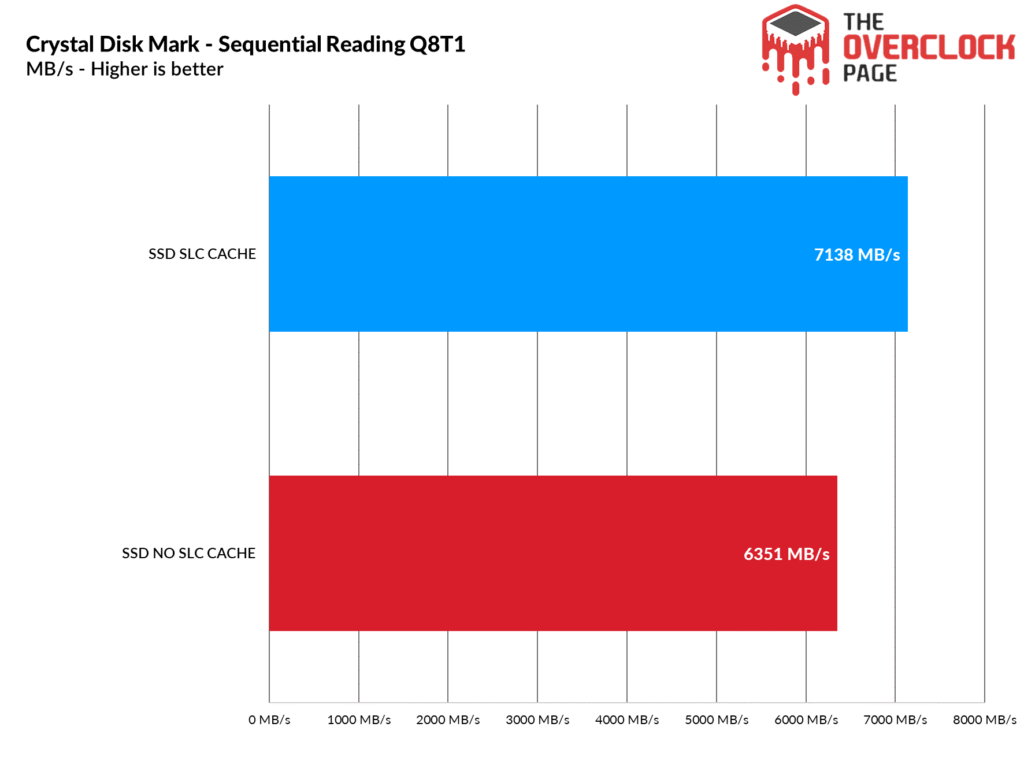

Starting with the sequential tests, the read performance saw a slight decrease, but in writing, it now only reaches the native speeds of the NAND when the SLC Cache is disabled.
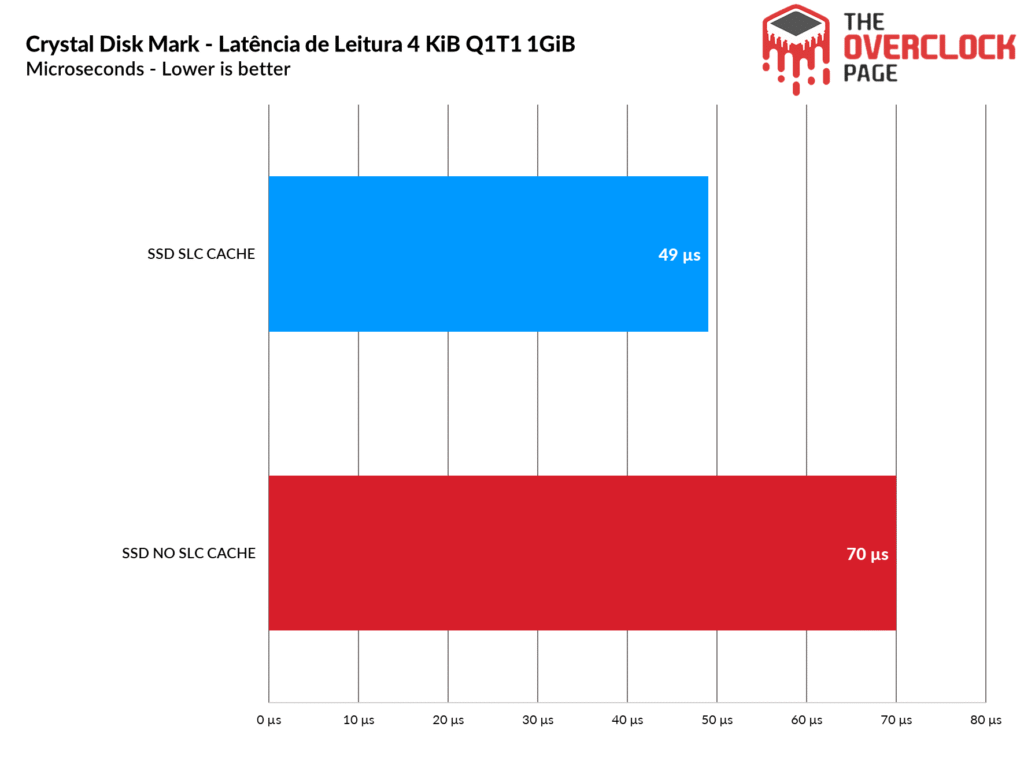
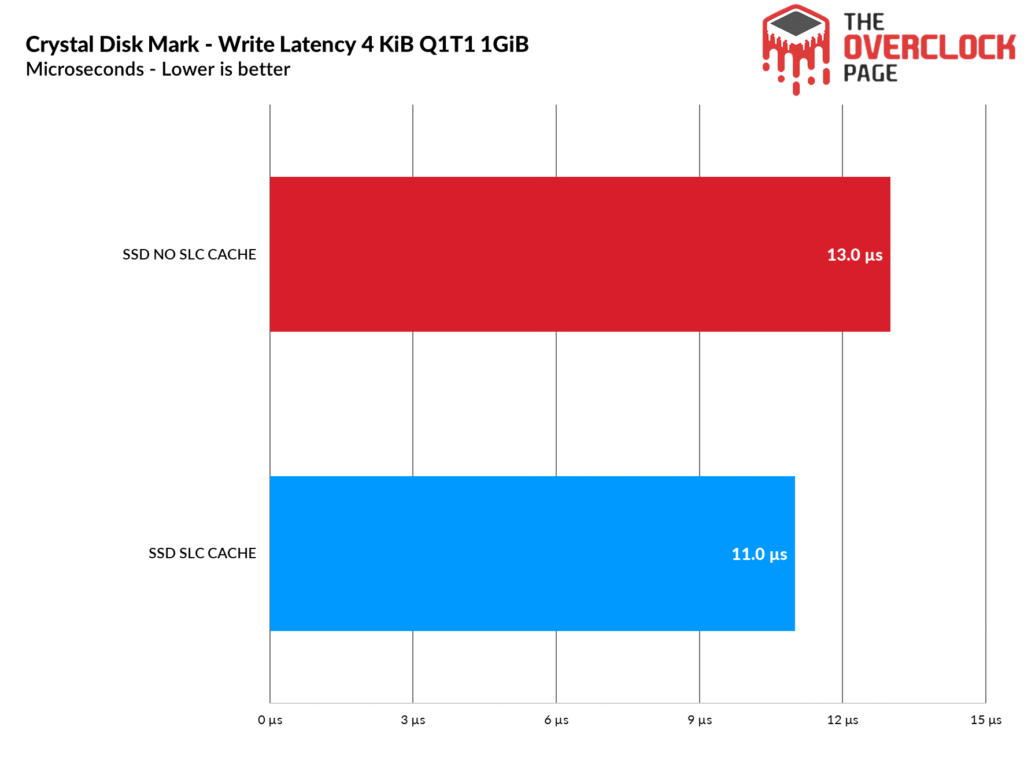
Interestingly, its write latency barely changed, although there was a noticeable difference compared to when the SLC Cache was enabled.
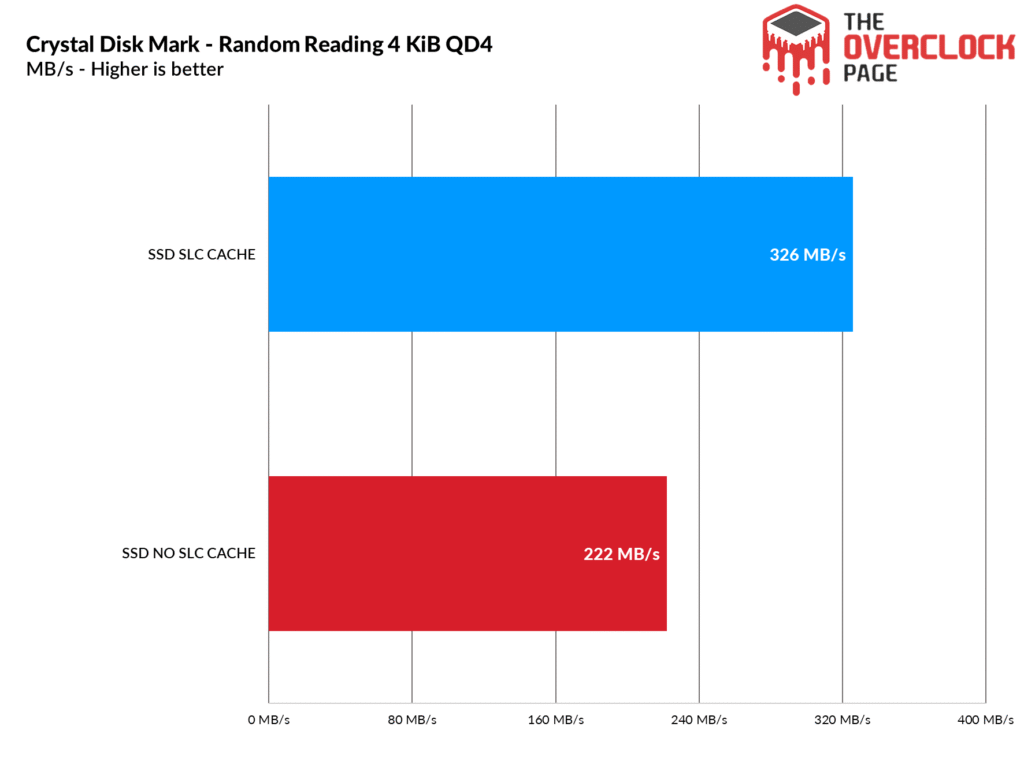

In random scenarios like this, the pSLC Cache significantly improved read performance. However, for writing, since it operates on the NANDs’ native capacity, there wasn’t a noticeable difference in performance, as the SSD can easily deliver over 1GB/s in write speed.
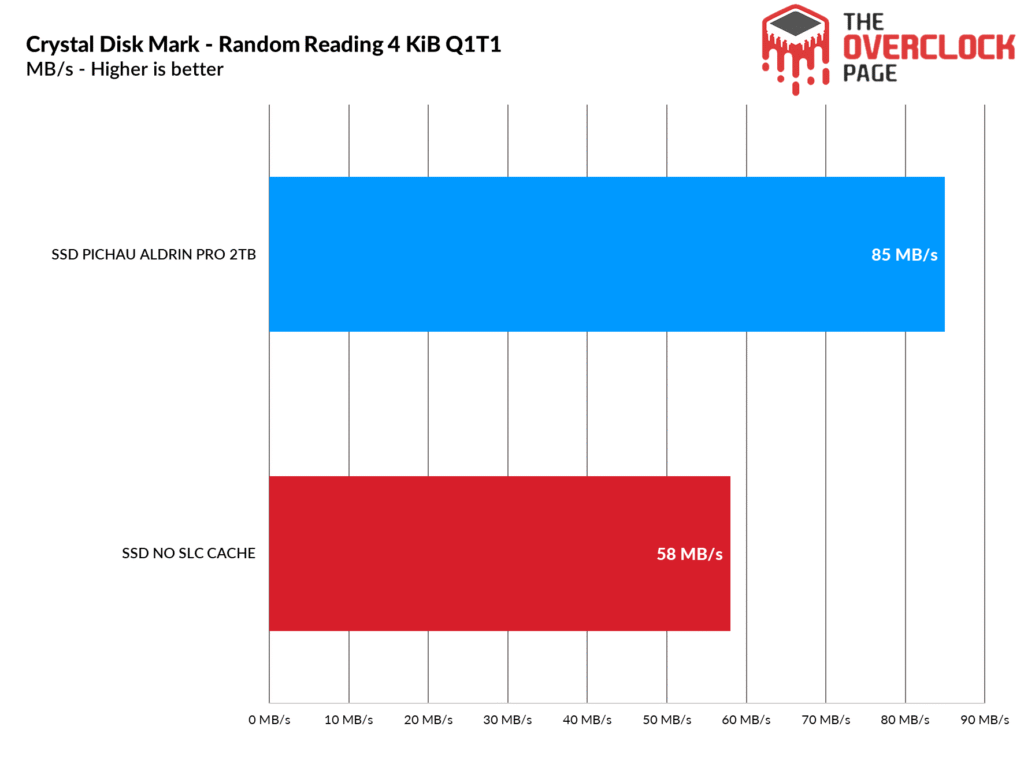

An interesting peculiarity is that with the pSLC Cache disabled, the read performance decreased, but the write performance was higher in some rounds, while in others, it was significantly lower. On average, the write performance ended up being higher overall.
3DMark – Storage Benchmark
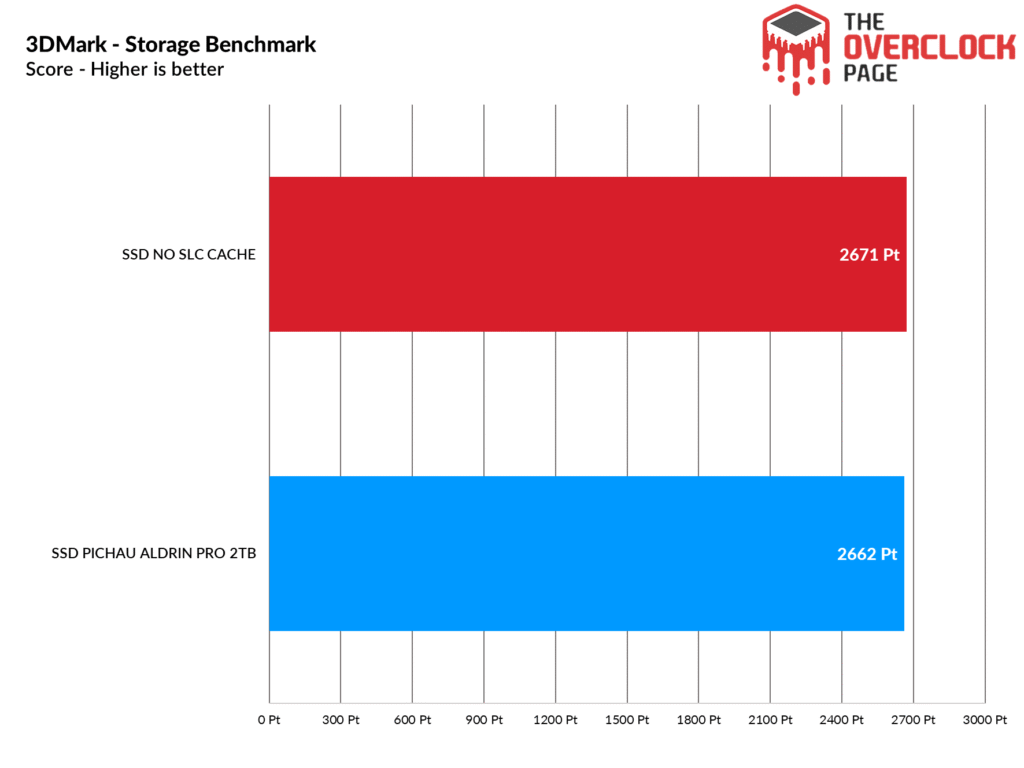
In this benchmark, various storage-focused tests are performed, including game loading tests like Call of Duty Black Ops 4, Overwatch, recording and streaming with OBS at 1080p 60 FPS, installation of several games, and file transfers from game folders.
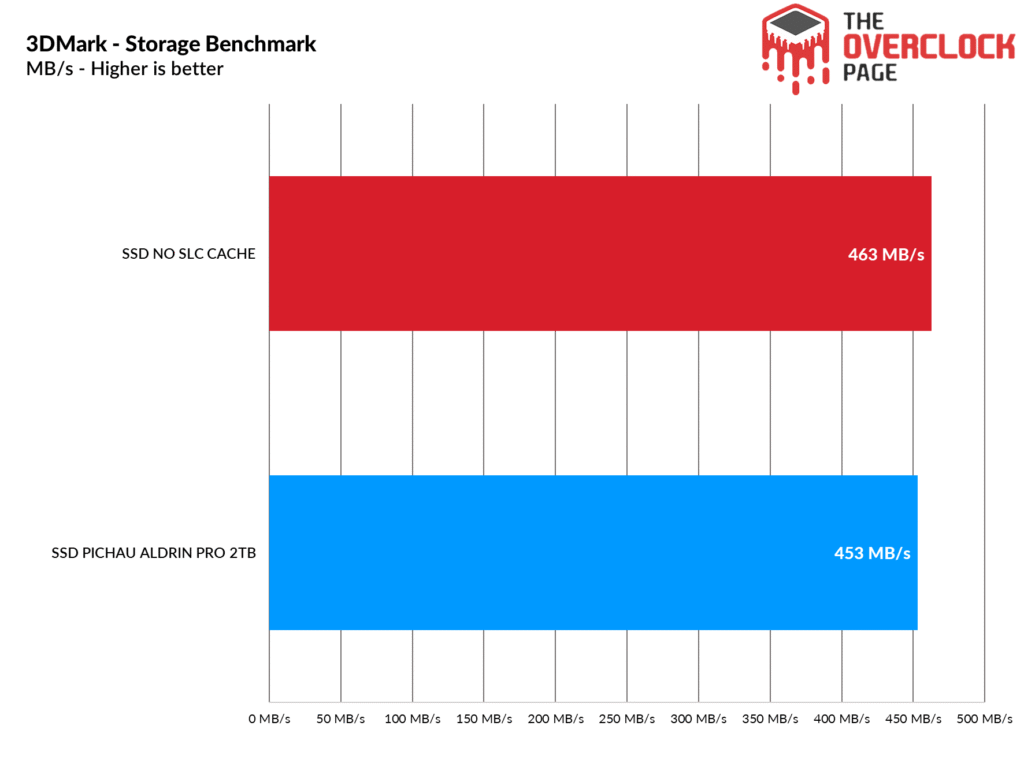
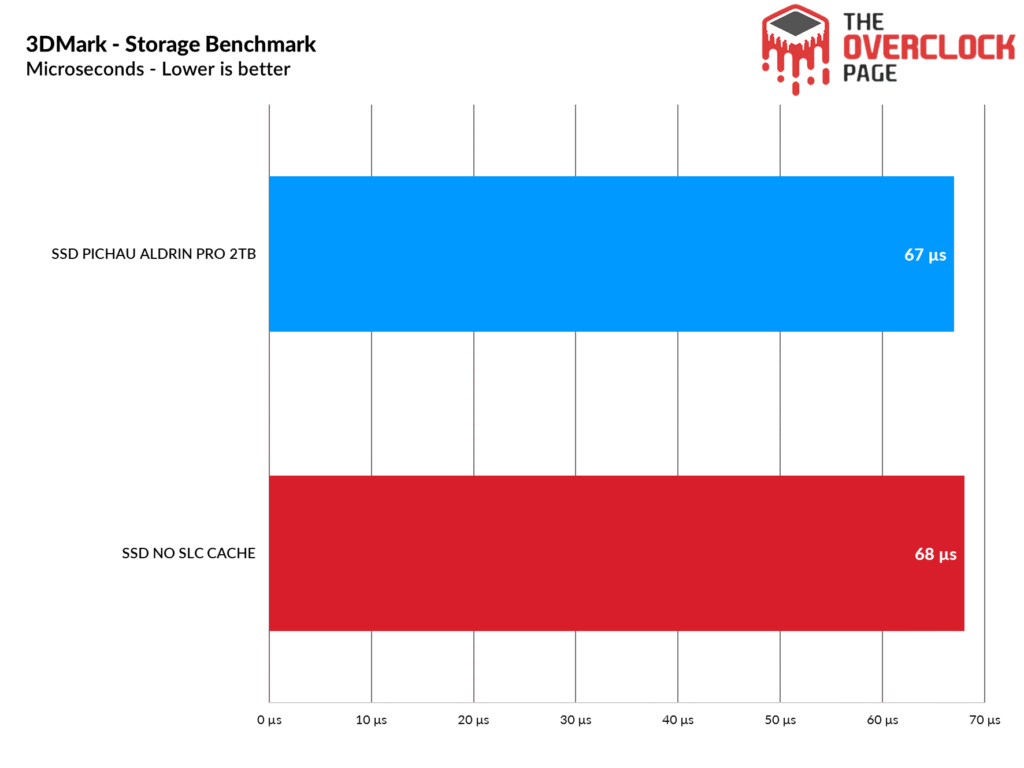
In this benchmark, which focuses more on casual environments, with the Cache disabled, the performance was very similar due to the less intensive workload, reflecting more realistic scenarios.
PCMARK 10 – FULL SYSTEM DRIVE BENCHMARK
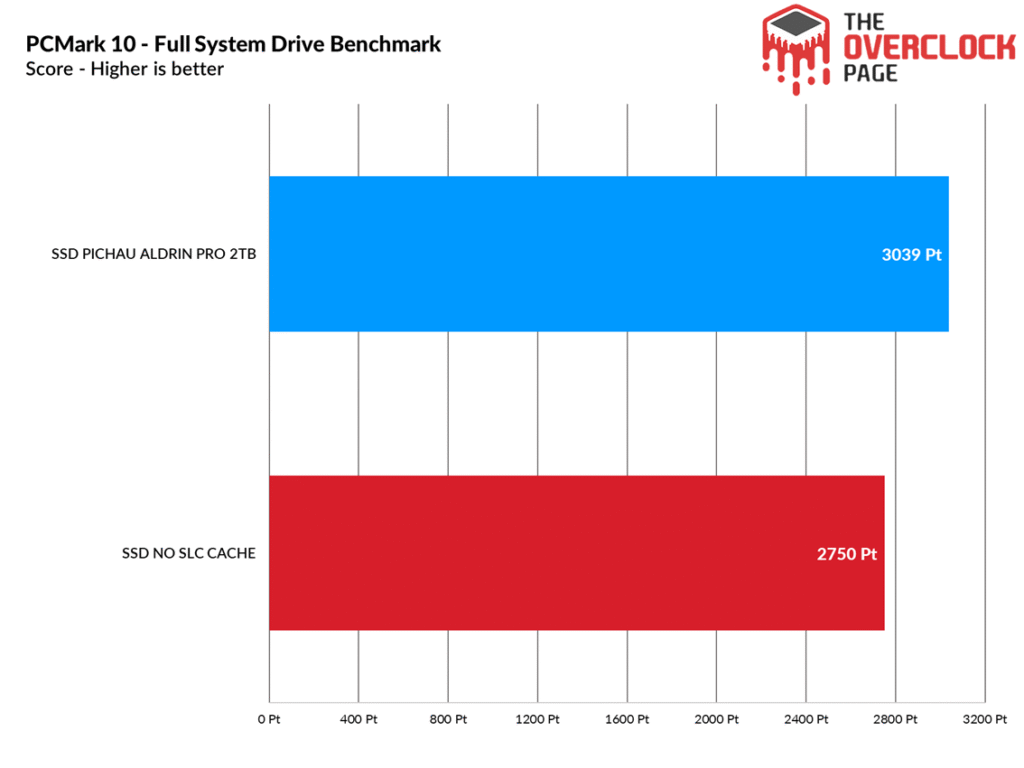
In this test, the “Storage Test” tool and the “Full System Drive Benchmark” were used, which perform both light and heavy tests on the SSD.
Among these traces, we can observe tests such as:
– Booting Windows 10
– Adobe After Effects: Launching the application until it’s ready for use
– Adobe Illustrator: Launching the application until it’s ready for use
– Adobe Premiere Pro: Launching the application until it’s ready for use
– Adobe Lightroom: Launching the application until it’s ready for use
– Adobe Photoshop: Launching the application until it’s ready for use
– Battlefield V: Loading time to the start menu
– Call of Duty Black Ops 4: Loading time to the start menu
– Overwatch: Loading time to the start menu
– Using Adobe After Effects
– Using Microsoft Excel
– Using Adobe Illustrator
– Using Adobe InDesign
– Using Microsoft PowerPoint
– Using Adobe Photoshop (Intensive use)
– Using Adobe Photoshop (Lighter use)
– Copying 4 ISO files, 20GB in total, from a secondary drive (Write test)
– Performing an ISO file copy (Read-write test)
– Copying the ISO file to a secondary drive (Read)
– Copying 339 JPEG files (Photos) to the tested drive (Write)
– Creating copies of these JPEG files (Read-write)
– Copying 339 JPEG files (Photos) to another drive (Read)
In this scenario, which is a practical benchmark with a slightly greater focus on writing than 3DMark, as it is more productivity-oriented, the practical difference is noticeable, albeit small, when the SLC Cache is disabled on the SSD.
Adobe Premiere Pro 2021
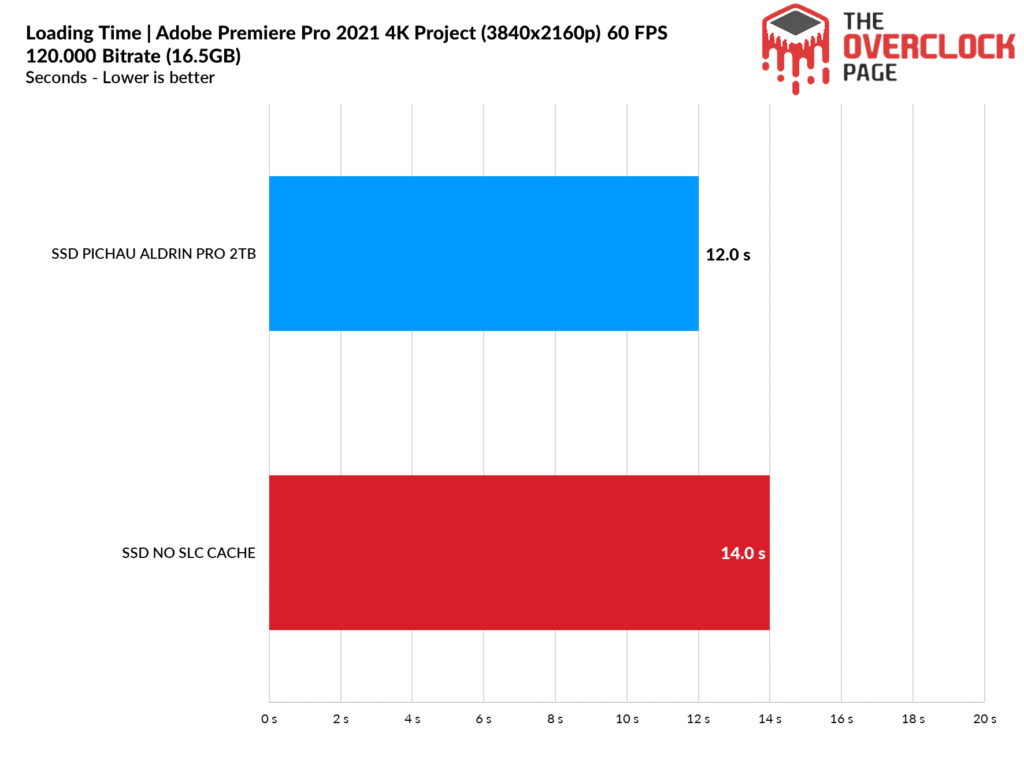
Next, we used Adobe Premiere to measure the average time it takes to open a 16.5GB project with 4K resolution, 120Mbps bitrate, and filled with effects, until it was ready for editing. It’s important to note that the tested SSD was always used as a secondary drive without the operating system installed, as this could affect the results and cause inconsistencies.
There was a small difference in the project loading time, but nothing too significant. However, in much larger projects, the difference could end up being more noticeable.
GAME LOADING TIMES AND WINDOWS BOOT TIME
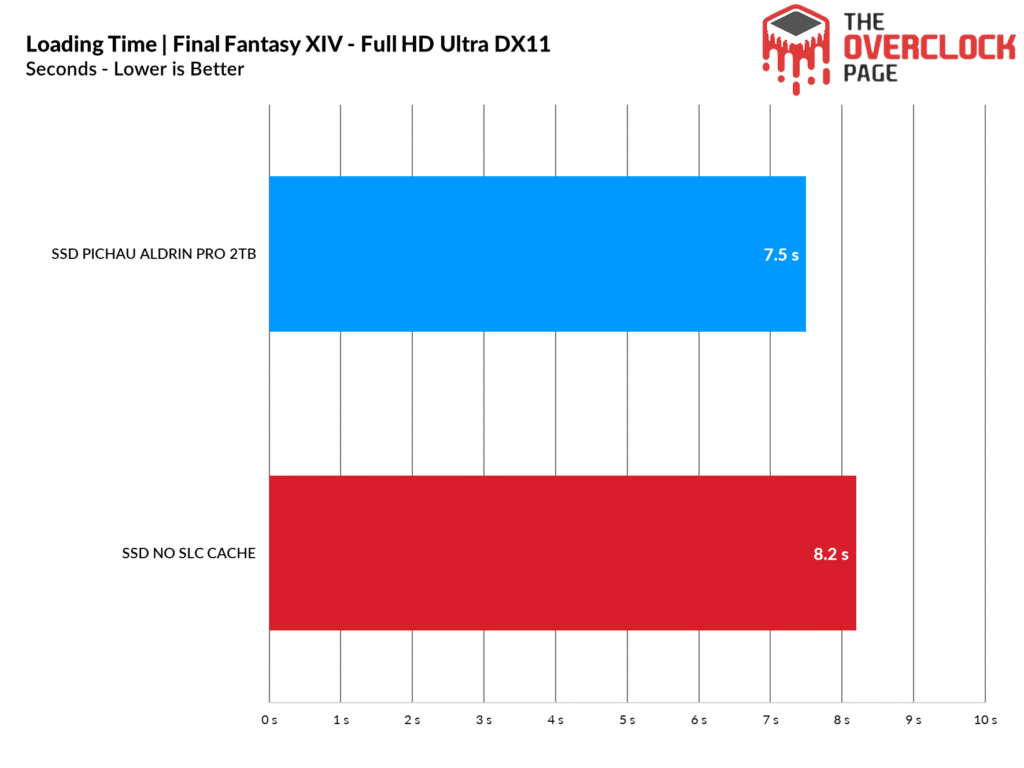
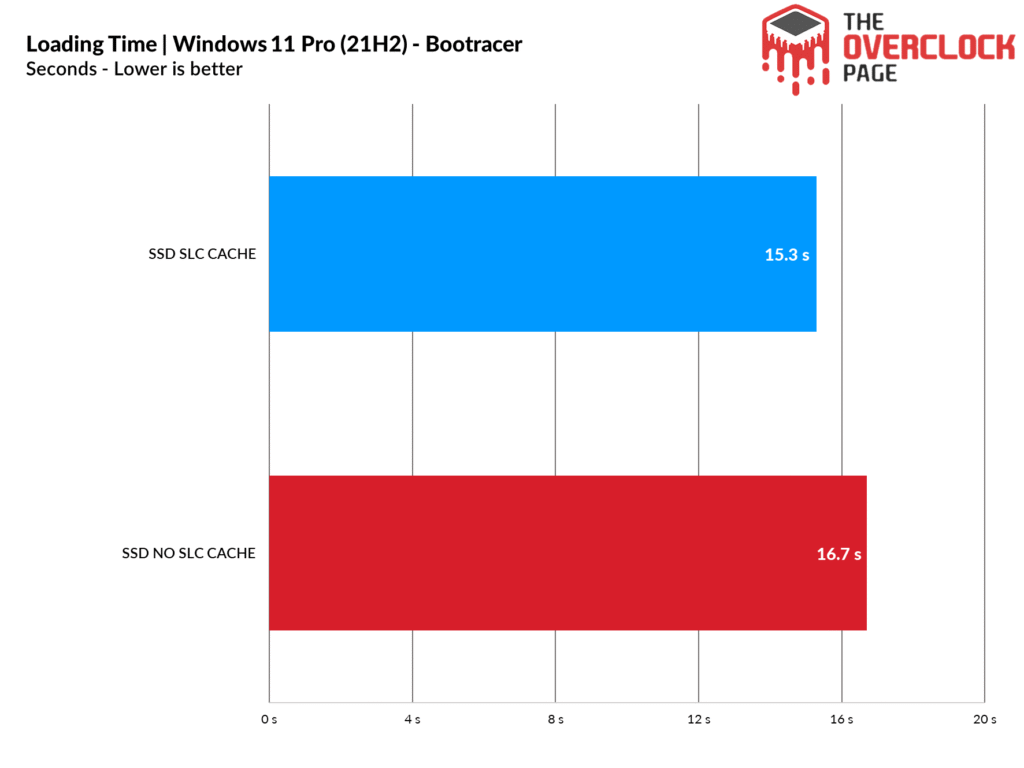
We conducted a comparison between the SSD with pSLC Cache and in pSLC Mode, using the Final Fantasy XIV benchmark.
The same occurs with game loading times, as the limitation lies in the game’s API, which is not optimized to show a significant difference.
Just like in games, Windows is unable to take full advantage of features like the ones we’ve applied to the SSD.
FILE COPY TEST
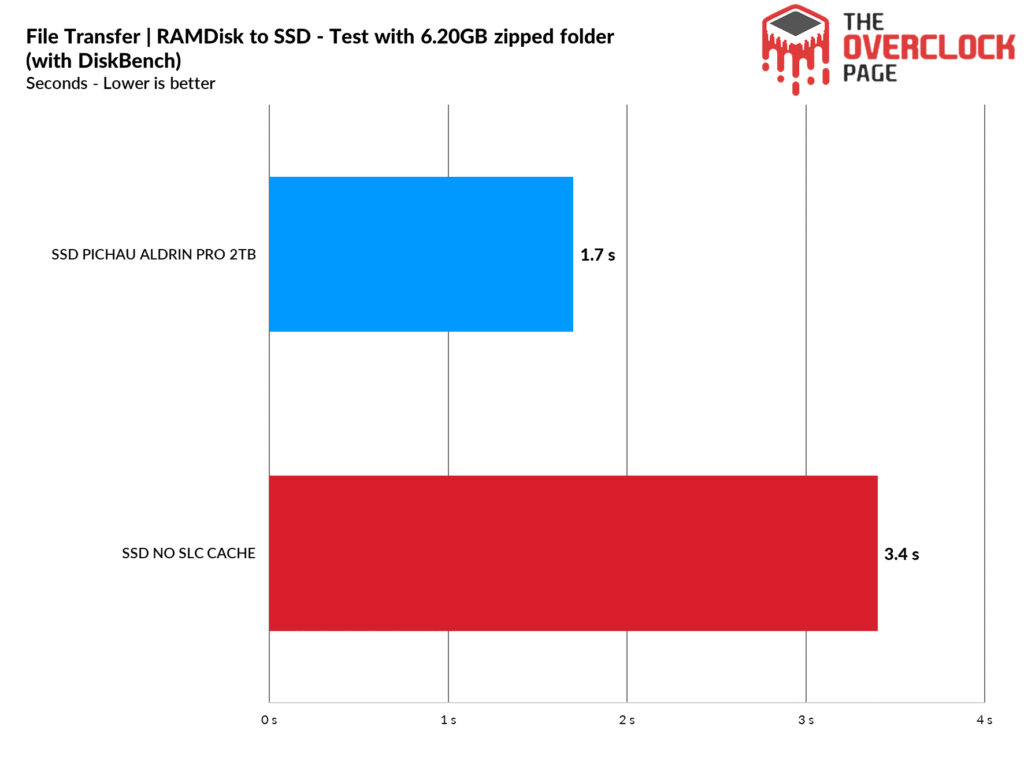
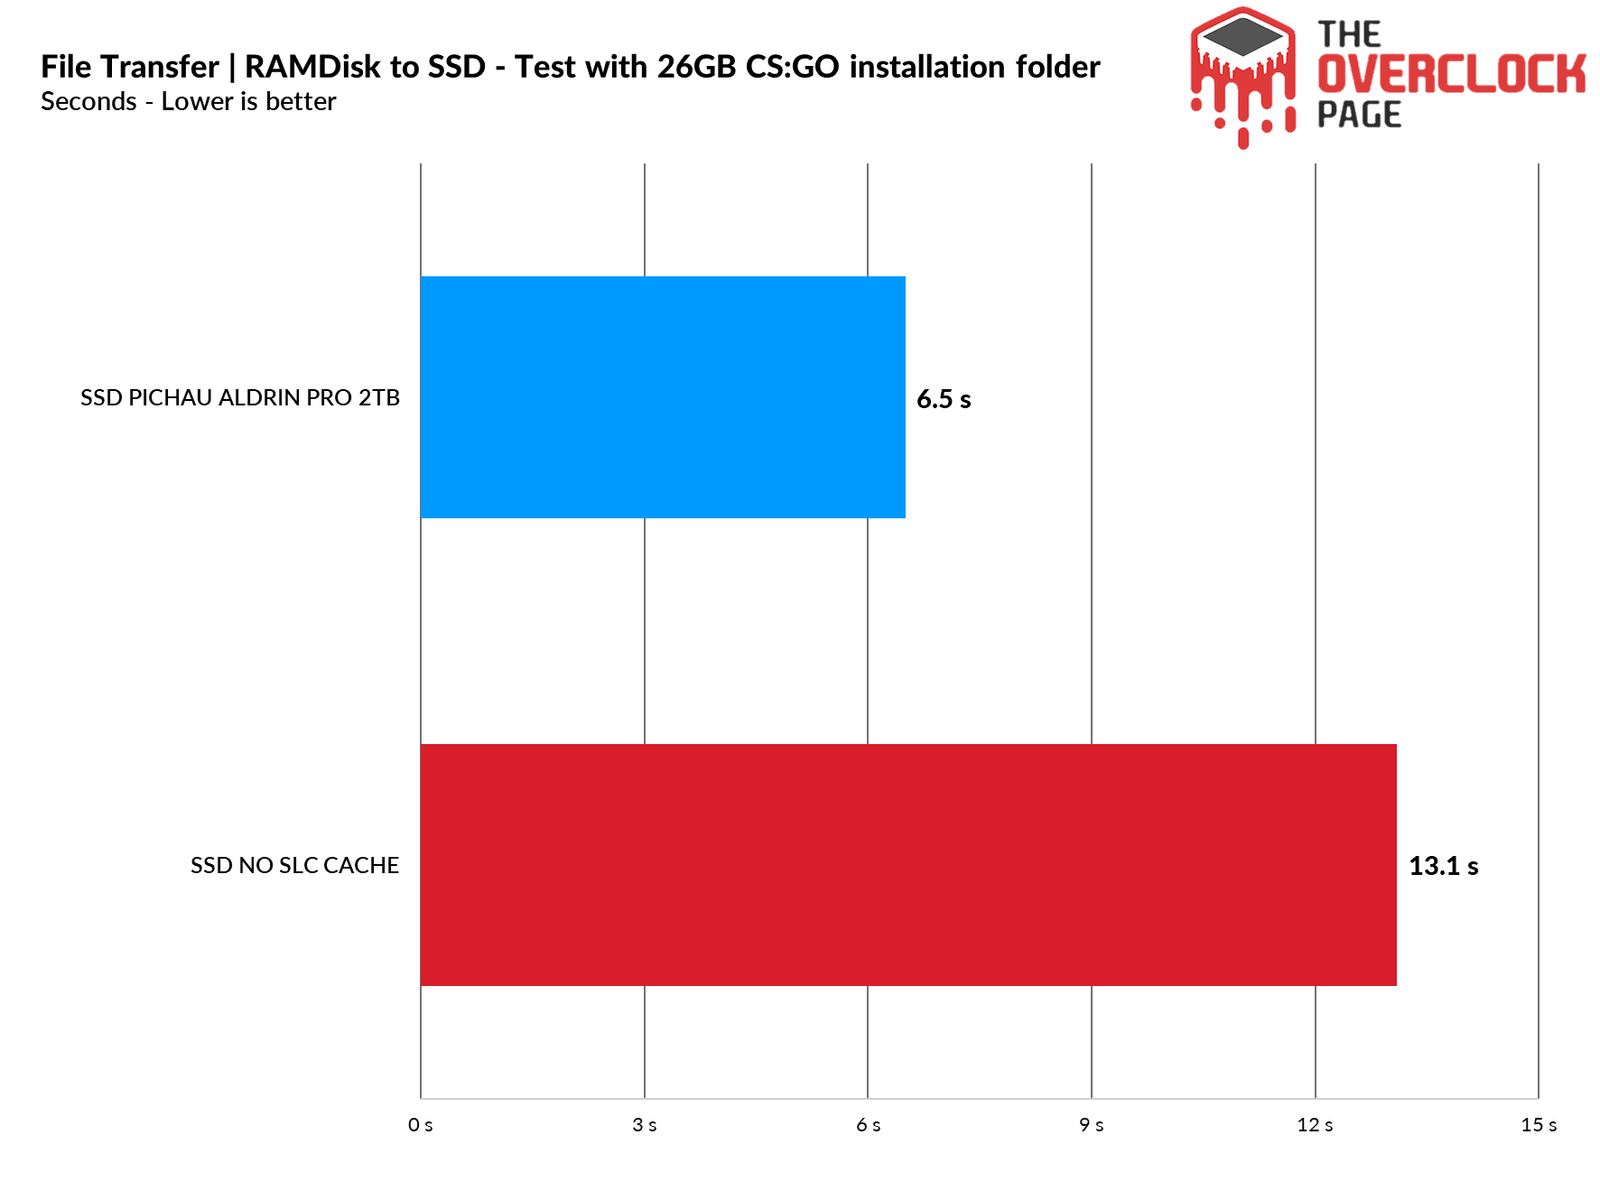
In this test, we copied ISO files and CSGO from a RAM Disk to the SSD to see how it performs. We used the Windows 10 21H1 ISO, which is 6.25GB (1 file), along with the CSGO installation folder, which is 25.2GB.
Here, the difference was striking. Even though these were typical quick transfers, the time taken was literally more than double compared to when the pSLC Cache was activated. With much larger files, this difference tends to worsen.
And as we mentioned earlier… the situation indeed worsened, proving that in scenarios like this, the pSLC Cache truly makes a significant difference.
TEMPERATURE
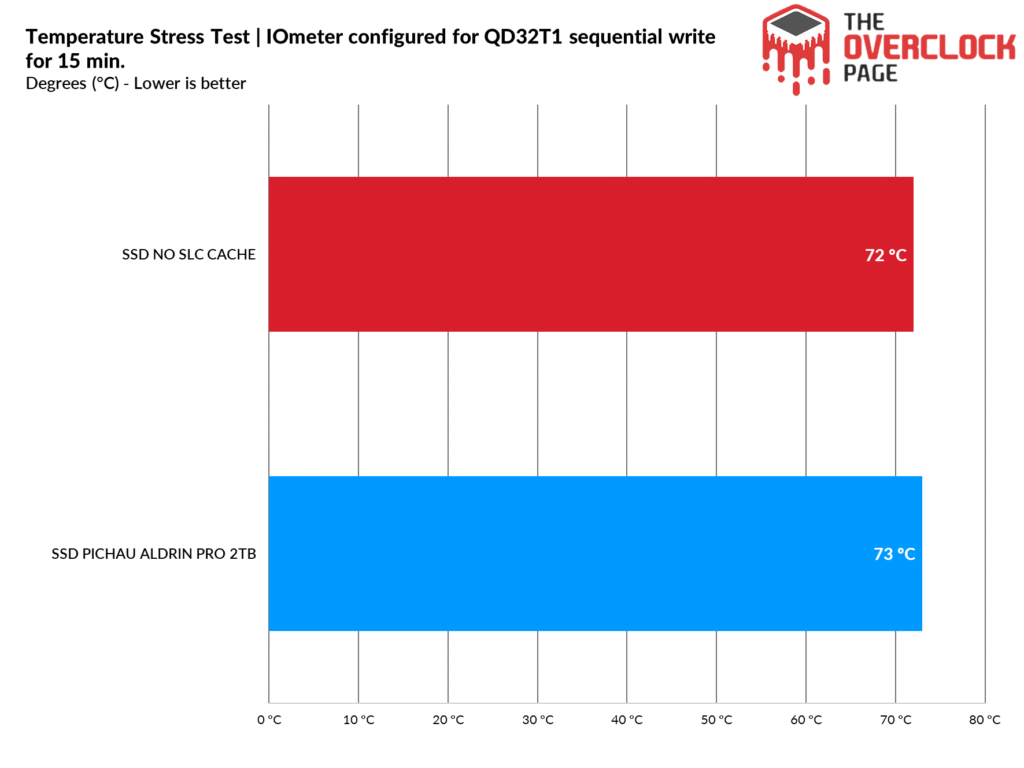
In this part of the analysis, we’ll observe the SSD’s temperature during a stress test, where the SSD continuously receives files to determine if any thermal throttling occurred with its internal components, potentially causing any bottlenecks or performance loss.
Regarding temperature, there was no difference; the SSD heated up in the same manner. What changed was the time it took to reach the maximum temperature. With the pSLC Cache activated, this maximum temperature is reached much more quickly due to its higher bandwidth.
POWER CONSUMPTION AND EFFICIENCY
SSDs, like many other components in our system, have a certain electrical consumption. The more efficient ones can complete requested tasks quickly and with relatively low power consumption, allowing them to transition back to their idle power states where the consumption tends to be lower.
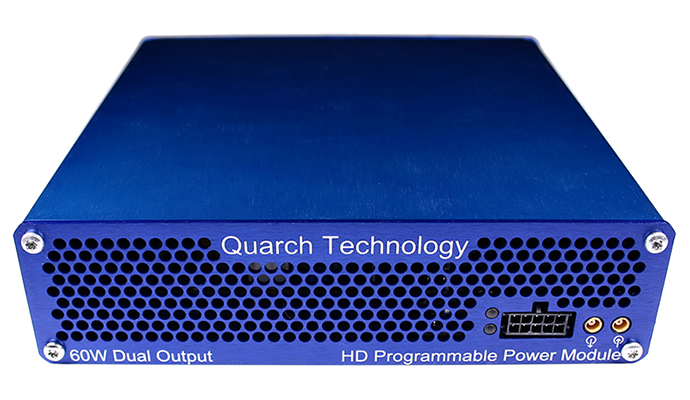
In this part of the analysis, we’ll use the Quarch Programmable Power Module provided by Quarch Solutions (see photo above) to conduct these tests and assess how efficient the SSD is. The methodology includes three tests: maximum consumption of the SSD, average consumption in practical and casual scenarios, and idle consumption.
This set of tests, especially for efficiency and idle states, is crucial for users who plan to use drives in laptops, as SSDs spend the vast majority of their time in low power states (idle), which significantly helps in saving battery.
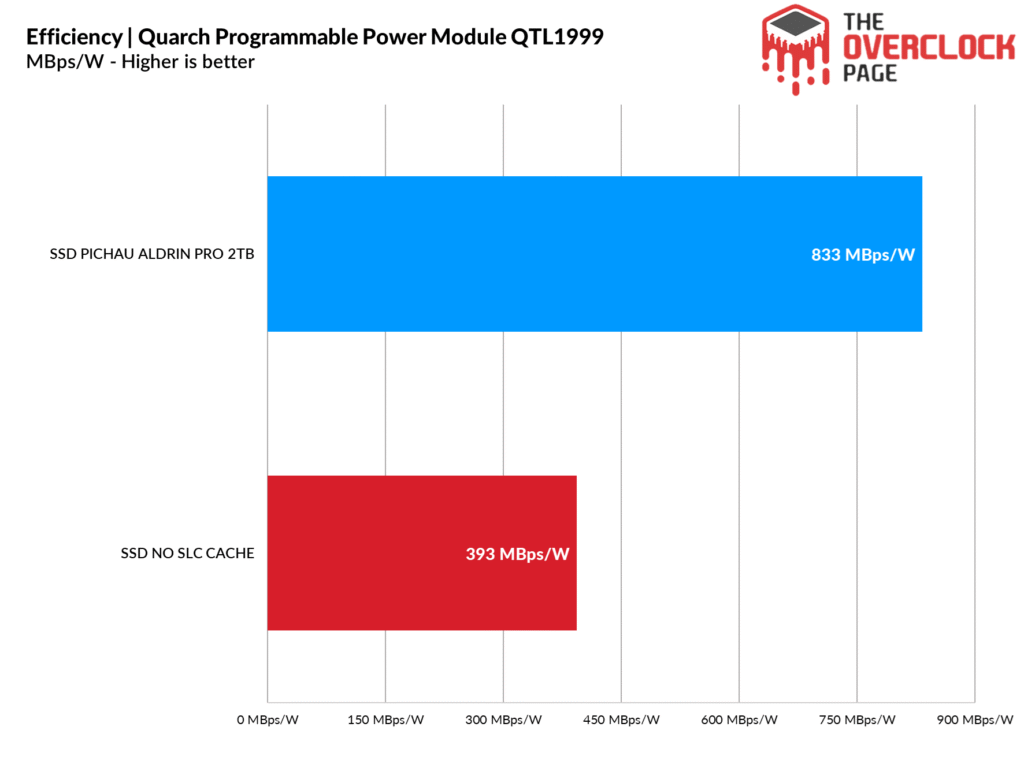
In terms of efficiency, there was a significant drop, even though the power consumption decreased. This happens because, although the bandwidth decreased, the power consumption also dropped. When the SLC Cache was active, the SSD’s power consumption was close to 5W, but it achieved over 3000 MB/s in bandwidth.
However, when the pSLC Cache was disabled, we observed that its bandwidth dropped to just above 1900 MB/s, nearly half of its previous rate, without any change in power consumption. This significantly impacted the SSD’s efficiency.
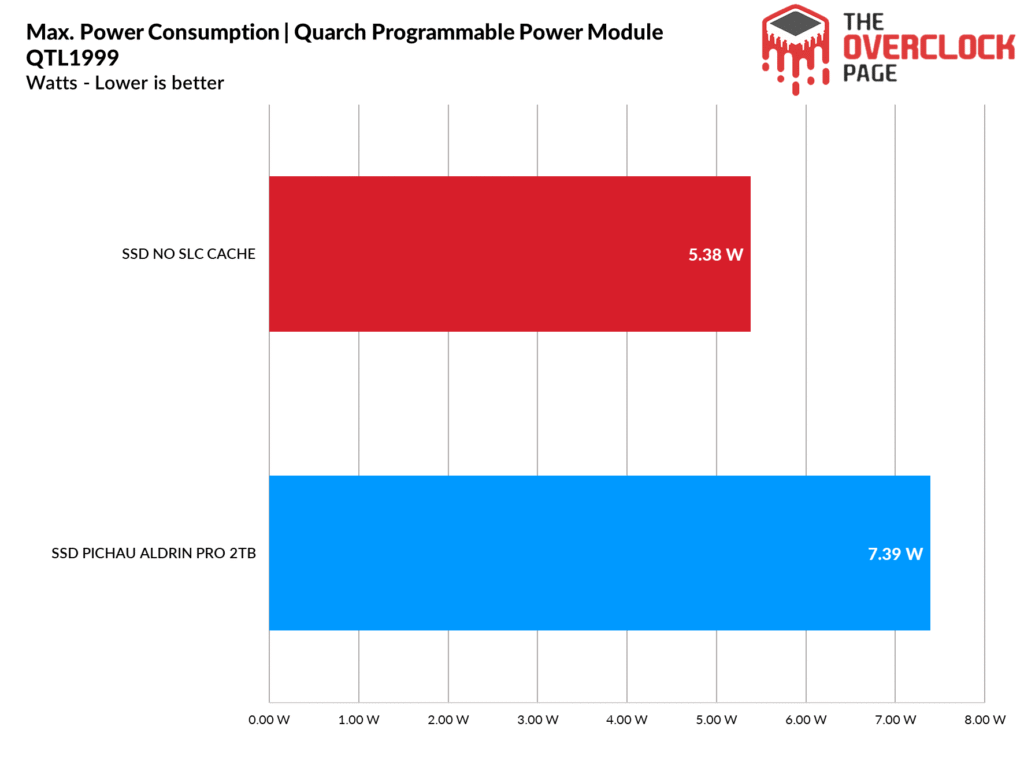
In its maximum consumption, there was indeed a significant difference. This occurred because the highest consumption by the SSD was in the SLC Cache region, where it exceeded 7.3W. Now that it operates in a constant TLC state, it does not reach that bandwidth, resulting in lower power consumption.
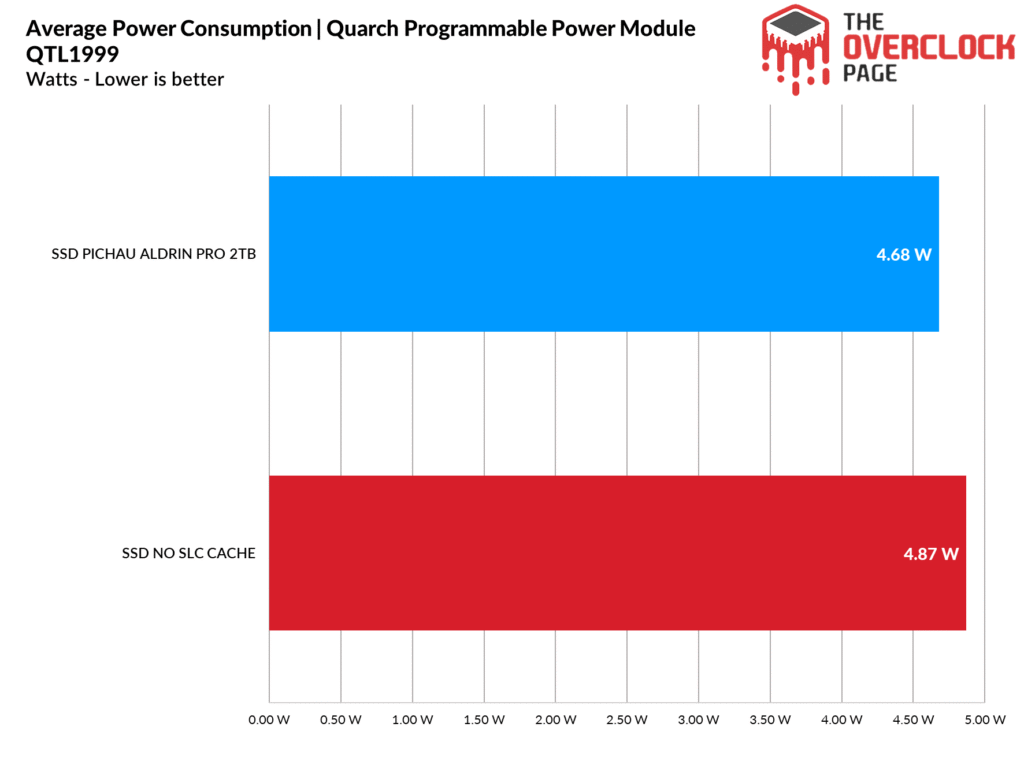
When averaging the power consumption during file transfers, we observed that there was no difference in this scenario.
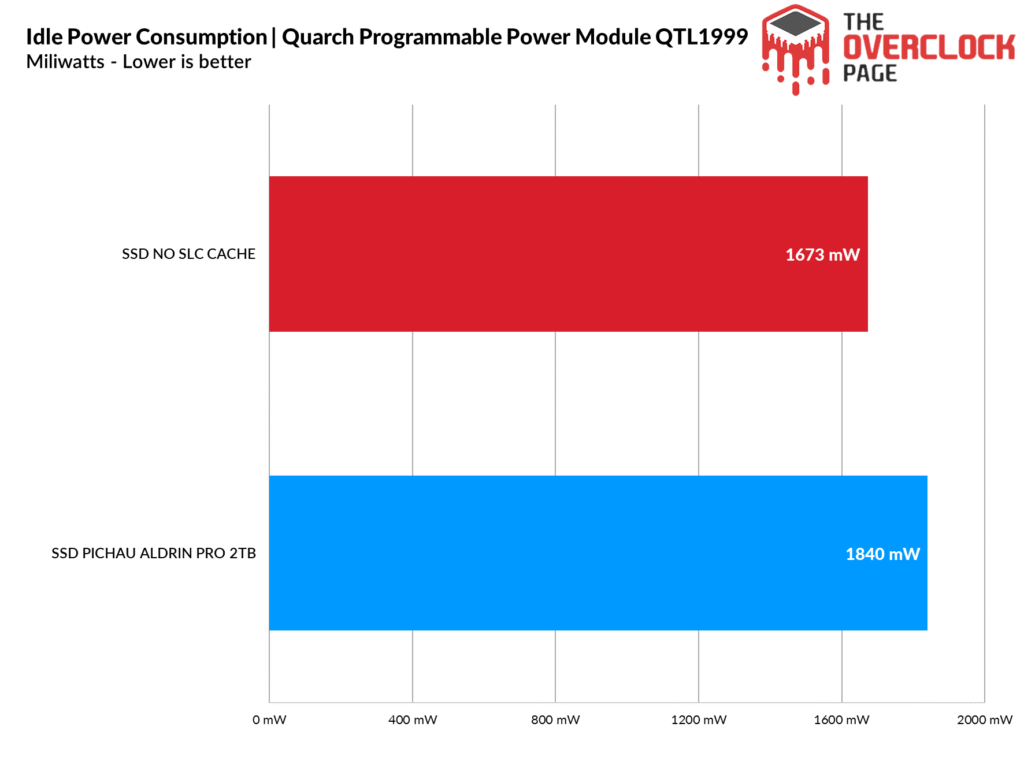
The same can be said for idle states, where the small difference might be just a variation between rounds.
What can we conclude from this?
The pSLC Cache has numerous advantages in performance across various scenarios, but in some cases, the difference is so small that it becomes imperceptible.
However, it also helps in terms of SSD efficiency and contributes to its durability. Therefore, the pSLC Cache significantly enhances the overall quality of a product like this.
