Review – SSD Teamgroup T-Force Z540 1TB – Another great Gen5 SSD!
Today, we will be testing a 1TB NVMe SSD from Teamgroup, the T-Force Z540 model, which was sent to us by Teamgroup for evaluation.
It comes in the M.2 form factor with a 128Gbps interface, meaning 4 PCIe 5.0 lanes, NVMe 2.0 protocol, and capacities ranging from 1TB to 4TB. Its price for the 1TB unit is around $149, which is quite high for an SSD. However, this is the average price for a high-end Gen5 SSD.
Specifications Teamgroup T-Force Z540 1TB
Next, here are more detailed specifications of the SSD that will be tested (1TB unit):
SSD’s Software
Teamgroup SSDs come with management software that allows for monitoring, reading SMART data, and more.
Unboxing
The packaging style is identical to that of the G50 SSD we tested recently, with an illustrative photo on the front and a cut-out section on the back, briefly showcasing the SSD.


When removing the SSD from the box, it comes in a plastic holder for added safety during transport. It is also clearly a double-sided design, featuring components on both sides.
On its front PCB (left image), we have the controller, DRAM Cache, 2 NAND flash chips, and its VRM. On the rear side, we have 2 more NAND flash modules, and an empty space for an additional DRAM Cache module, which is used in higher capacities.


It can also be purchased together with the Dark AirFlow I heatsink, which is sold separately. We will conduct tests with it and see if it truly helps with the temperatures.

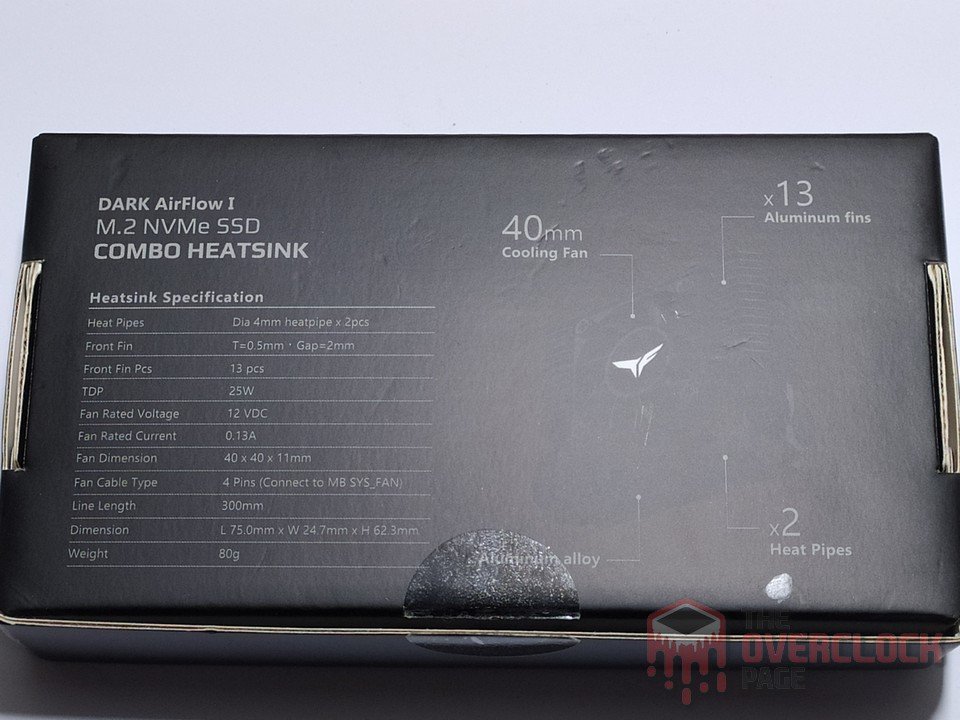
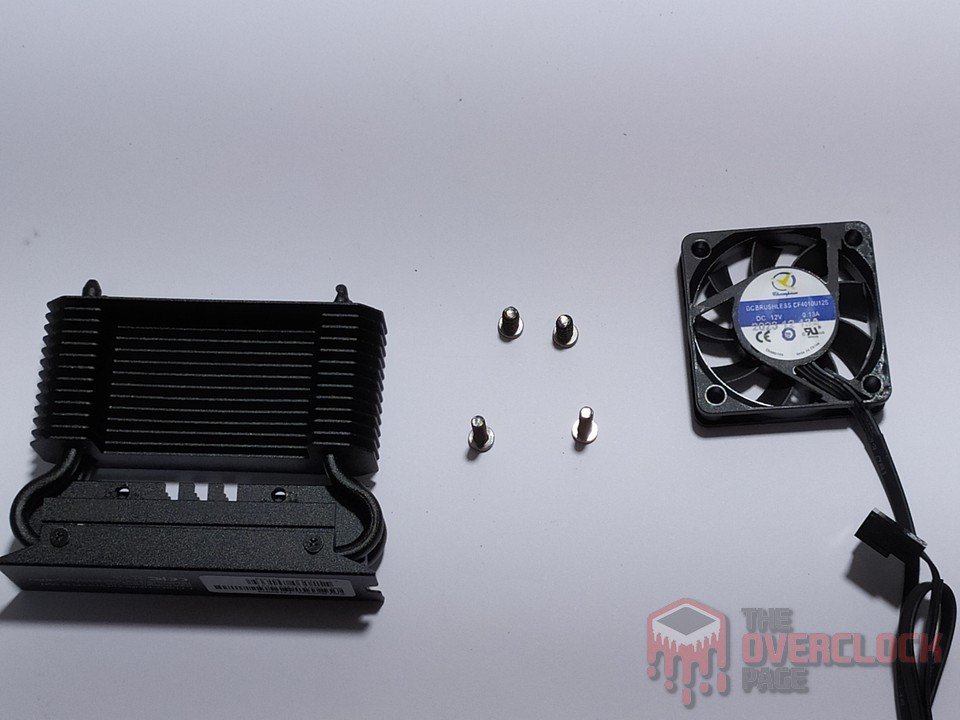
When we remove the heatsink from the box, we find a quite imposing piece with a tall profile and active cooling. Its dimensions are 75mm in length, 24.7mm in width, 62.3mm in height, and it weighs approximately 80g, which is significantly more than the SSD itself.


This design includes 2 x 4mm heatpipes and 13 aluminum fins, along with a 40mm fan.
The disassembly process of the product is quite simple; there are 4 Philips screws, and the fan is released.
As previously noted, the fan measures 40mm and has a maximum power consumption of 1.56W, operating at 12V with a current of 0.13A. Since it is a 12V component, it requires an external 4-pin PWM connector for power, as it cannot be directly powered by the SSD’s PCB.
Controller
The SSD controller is responsible for managing all data, over-provisioning, garbage collection, and other background functions. Of course, this contributes to the SSD’s overall performance.
This SSD uses a high-end Phison controller: the PS5026-E26-52, a 32-bit ISA ARM model with “5” cores. However, this time, Phison has redesigned the controller. It features 2 Cortex® R5 cores (Dual-core) with a 12nm TSMC manufacturing process, running at clock speeds between 966 MHz and 1 GHz on the main cores. Meanwhile, its secondary cores are now AndesCore 32-bit N25F RISC-V architecture cores.
For the E26, 3 of these N25F cores are used for repetitive tasks to reduce power consumption. We estimate that these cores are operating between 400 and 500 MHz.
This controller is common in other high-end SSD projects such as the Adata Legend 970, Corsair MP700, Sabrent Rocket 5, among others.
The E26 also supports up to 8 communication channels with a bus speed of up to 2400 MT/s, where each of these channels supports up to 4 Chip Enable commands, enabling the controller to communicate with up to 32 dies simultaneously using interleaving techniques.
DRAM Cache or H.M.B.
Every high-end SSD aiming to provide consistent high performance requires a buffer to store its mapping tables (Flash Translation Layer or Look-up table). This allows it to achieve better random performance and be more responsive.
In this project, we observe that the manufacturer chose to use an LPDDR4 module, which, as the name suggests, is Low Power, designed to help reduce the power consumption of these devices, considering that this controller is known for its high power consumption.
The SSD uses an IC marked “H9HCNNNBKUMLXR-NEE,” manufactured by SK Hynix, and it is a 2GB LPDDR4 module, which is commonly found alongside the E26 controller.
NAND Flash
Regarding its NANDs, the 1TB SSD contains 4 NAND Flash chips marked as “NY253.” This part number represents the “MT29F2T08EELCHD4-QB:C” NAND from Micron, which in this case are 3D TLC B58R FortisFlash 1Tb 232-Layers (128GB) dies, with 232 layers of data and a total of 255 gates, resulting in an array efficiency of 91.0%.

In this project, we have 4 NANDs, each with a total of 256GB. Since each die has a density of 128GB (1Tb), we can assume that these are 2DP NANDs (2 dies per NAND). Together, there are 8 dies of 128GB, totaling 1TB, which communicate with the controller via a 2000 MT/s bus.
Among the Gen5 SSDs available on the market, there are three categories of sequential performance: those that reach 10GB/s, those at 12GB/s, and the newer models that exceed 14GB/s.
This happens because, as of this analysis, all large-scale production models use the Phison E26 controller with these Micron B58R NANDs, which were developed to operate at 2400 MT/s.
If we take the 8 channels of this controller and multiply them by the NANDs bus speed of 2400 MT/s, we would arrive at a theoretical maximum bus speed of 19,200 MB/s or 19.2GB/s. However, due to overhead, SSDs are limited to below 15,000 MB/s.
The difference between the 10GB/s, 12GB/s, and 14GB/s Gen5 SSDs is the bus speed at which the NANDs work with the controller. The first generation of Gen5 SSDs reached only 10GB/s.
This occurred because of Phison’s decision to configure these B58R NANDs to operate at a speed of 1600 MT/s, resulting in a theoretical maximum bus speed of 12.8GB/s. However, due to overhead, the SSDs could only achieve 10GB/s in practice.
For those SSDs reaching nearly 12GB/s, the same occurs because Phison configures the NANDs to operate at a bus speed of 2000 MT/s, limiting the SSDs to 16GB/s. When accounting for overhead, this results in the speeds seen in the SSD of this review.
Finally, we have the newer SSDs that come with these B58R NANDs configured at 2400 MT/s, which can now fully saturate the PCIe 5.0 x4 connection and bus.
But why did Phison do this? The exact reason is not known, and it has never been disclosed to consumers. However, it could be related to signal integrity, as working with PCIe 5.0 signals can be tricky. For those who have used PCIe riser cards for graphics cards, they may know that lower-quality adapters can have trouble operating stably, requiring a downgrade in connector generations, such as from PCIe Gen4 to PCIe Gen3.
This could be one possibility, as the controller might have faced instability and performance issues when operating at 2400 MT/s.
PMIC (Power Delivery)
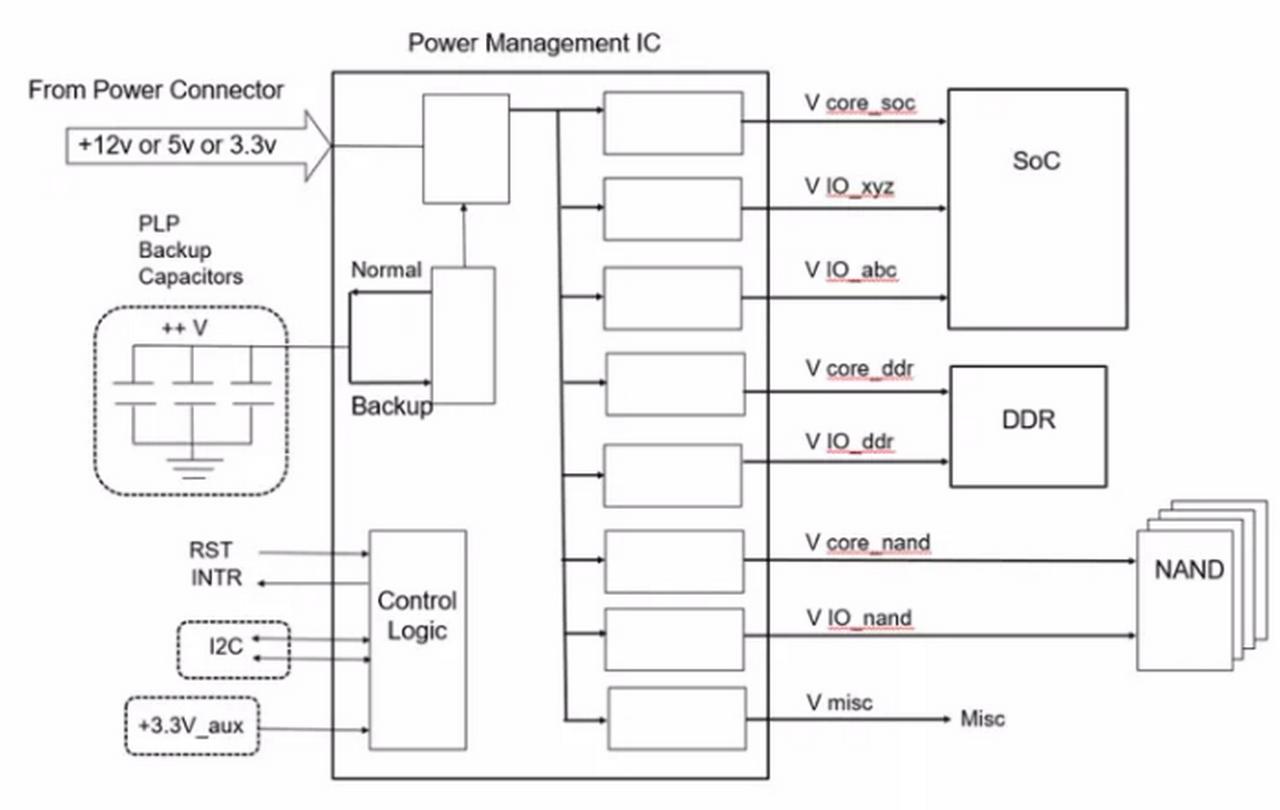
Just like any electronic component that performs work, SSDs also have a level of power consumption that can range from just a few milliwatts to close to 10 watts, nearing the limits of some connectors or slots. The circuit responsible for managing all power is the PMIC, which stands for “Power Management IC,” a chip responsible for supplying power to other components.


In this project, we observe that Phison uses its standard PMIC, the PS6121-45, which internally features some load switches.
SSD Power States
As we always mention in energy consumption analyses, in this section, we will dive deeper into the power states of this SSD.
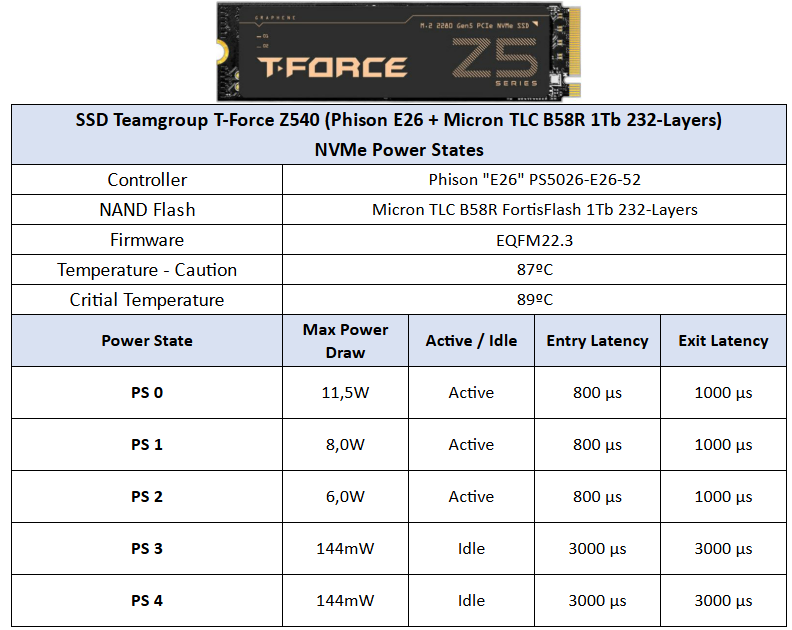
Like any standard NVMe, there are 5 main power states: 3 active power states under different workloads and 2 in idle. However, we did not observe it reaching these idle power states, even when the SSD was idle.
CURIOSITIES ABOUT THE TEAMGROUP Z540
Just like RAM chips in a memory module can vary, the same happens with SSDs, where components such as the controller and NAND flash may change over time.
So far, we haven’t found any hardware variations in this product, which is good news.
TEST BENCH
– OS: Windows 11 Pro 64-bit (Build: 23H2)
– CPU: Intel Core i7 13700K (5.7GHz all core) (E-cores e Hyper-threading desabled)
– RAM: 2 × 16 GB DDR4-3200MHz CL-16 Netac (c/ XMP)
– Motherboard: MSI Z790-P PRO WIFI D4 (Bios Ver.: 7E06v18)
– GPU: RTX 4070 Ti Super Colorful (Drivers: 555.xx)
– (OS Drive): SSD Solidigm P44 Pro 2TB (Firmware: 001C)
– DUT SSD: SSD Teamgroup Z540
– Chipset Driver Intel Z790: 10.1.19376.8374.
– Windows: Indexing disabled to avoid affecting test results.
– Windows: Windows updates disabled to avoid affecting test results
– Windows: Most Windows applications disabled from running in the background.
– Boot Windows: Clean Image with only Drivers
– Test pSLC Cache: The SSD is cooled by fans to prevent thermal throttling, ensuring it doesn’t interfere with the test results.
– Windows: Antivirus disabled to minimize variation in each round.
– DUT SSDs: Used as a secondary drive, with 0% of space being utilized, and other tests conducted with 50% of space utilized to represent a realistic scenario.
– Quarch PPM QTL1999 – Power consumption test: conducted with three parameters—idle, where the drive is left as a secondary, and after a period of idle, a one-hour write test is performed, and the average power consumption is recorded
CRYSTALDISKMARK
We conducted synthetic sequential and random tests with the following configurations:
Sequential: 2x 1 GiB (1 MiB Blocks) 8 Queues 1 Thread
Random: 2x 1 GiB (4 KiB Blocks) 1 Queue 1/2/4/8/16 Threads


Compared to the Crucial T700 we tested last year, which has an identical internal construction, we will see that many of the benchmarks show very similar results.


Both the latencies of the T700 and Z540 were similar, as we explained earlier. However, in terms of write performance, they did not perform as well as the Solidigm P44 Pro, which still reigns supreme as one of the best-performing Gen4 SSDs.


In its random speeds at QD4, we observed that the Z540 had slightly lower performance compared to the T700. A peculiar thing is that, even after running the benchmark multiple times, the result remained consistent.


In QD1, we observed the same behavior as in QD4.
ATTO Disk Benchmark QD1 and QD4
We conducted a test using ATTO to observe the speed of the SSDs at different block sizes. In this benchmark, the configuration was as follows:
Blocks: Ranging from 512 Bytes to 8 MiB
File Size: 256MB
Queue Depth: 1 and 4.

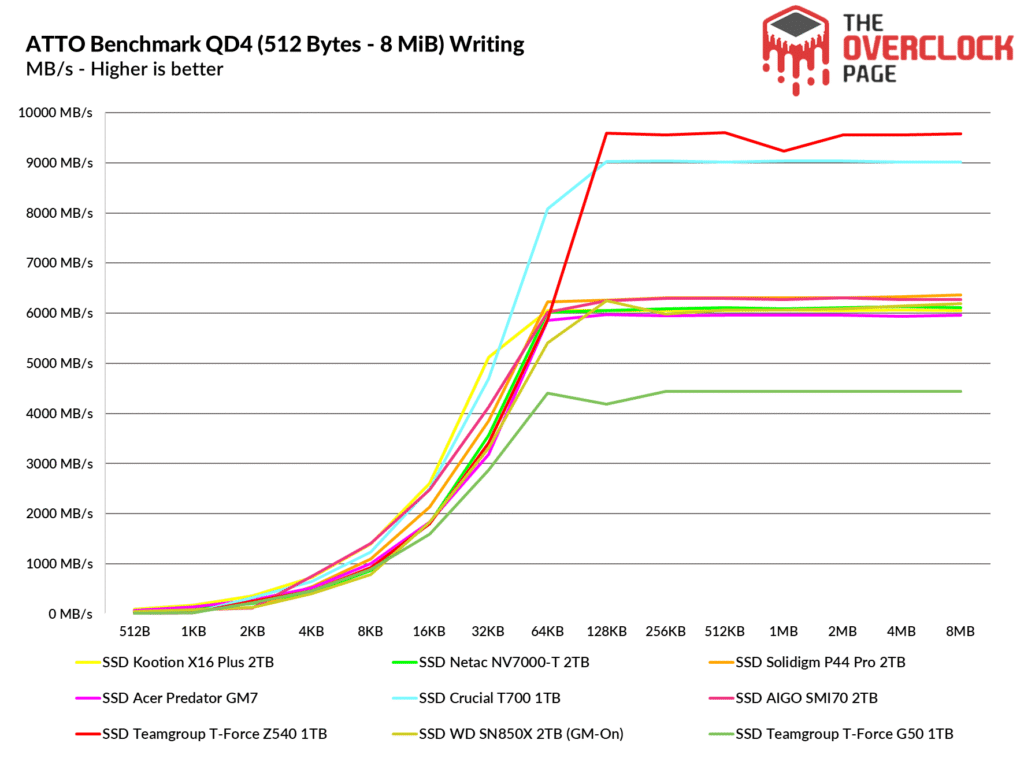
The ATTO Disk Benchmark is a software that performs a sequential speed test with compressed files, simulating a data transfer load similar to what we encounter in Windows. Typically, the block sizes range from 128KB to 1 MiB. Both Gen5 SSDs showed similar results, with the Z540 initially lagging behind the T700 at the beginning of the benchmark. However, shortly after, it managed to catch up to the T700.


Both Gen5 SSDs experience a performance drop near 2 MB in their read speeds due to the architecture of their NANDs. These use 6-plane NANDs with 16KB pages and an 8-channel controller. The performance drop occurs because of the super-pages located in each NAND block, which result in this performance dip due to interleaving.
3DMark – Storage Benchmark
In this benchmark, various storage-related tests are performed, including game loading tests such as Call of Duty Black Ops 4, Overwatch, recording and streaming with OBS of a 1080p 60 FPS gameplay, installation of some games, and file transfers from game folders.


In this benchmark, which features numerous realistic traces for both work and everyday use, the Gen5 models achieved the best results in the comparison. What was interesting to observe is that they almost surpassed the 1GB/s barrier in the bandwidth test.
PCMARK 10 – FULL SYSTEM DRIVE BENCHMARK
Here, the “Storage Test” tool and the “Full System Drive Benchmark” were used, which perform both light and heavy tests on the SSD.
Among these traces, we can observe tests such as:
The content lists various tasks related to file management and software usage. It includes copying JPEG and ISO files, booting Windows 10, and launching applications such as Adobe After Effects, Illustrator, Premiere Pro, Lightroom, and Photoshop. Additionally, it mentions loading times for video games like Battlefield V, Call of Duty Black Ops 4, and Overwatch, along with tasks involving Microsoft Excel, PowerPoint, and Adobe InDesign. The tasks range from simple file copying to heavy and light usage of Adobe Photoshop.
In this benchmark, which also features some realistic traces but with a greater focus on productivity, the same behavior is observed. Due to its high bandwidth compared to Gen4 SSDs, the Z540 leads the comparison.
Adobe Premiere Pro 2021
Next, we used Adobe Premiere to measure the average time to open a project of about 16.5GB with 4K resolution and a 120Mbps bitrate, full of effects, until it was ready for editing. It is important to note that the tested SSD is always used as a secondary drive without the operating system installed, as this could affect the result, creating inconsistencies.
When using Premiere to load a project of over 16GB, there was another technical tie between these 2 Gen5 SSDs, both showing very good results.
BOOT LOADING TIMES AND GAME LOADING TIMES
Here, we have a comparison between multiple SSDs and a hard drive, using a clean installation of Windows 10 Build 21H1 along with the Final Fantasy XIV benchmark in campaign mode. The test consists of the best result after three consecutive system boots, considering the total time until reaching the desktop, with the score reported by the application. Therefore, it is slower than just booting to the desktop screen.
In this benchmark focused on game loading, all the NVMe SSDs show very little difference between each other, and both Gen5 models were no exception. Since most games are not optimized with the DirectStorage API, we won’t see a significant performance difference here.
In this program, the boot time until the loading of the last OS drivers is measured. In this case, a clean installation is performed with only the operating system drivers, such as Network, Wireless + Bluetooth, Audio, Nvidia drivers, PCH, among others. The same can be said for system loading, as we are limited by how Windows manages the boot process. Even with the fastest SSDs available, we can’t drastically reduce these times.
SLC CACHING
A large number of SSDs on the market currently use SLC Caching technology, where a certain percentage of their storage capacity, whether it is MLC (2 bits per cell), TLC (3 bits per cell), or QLC (4 bits per cell), is used to store only 1 bit per cell. In this case, it is used as a read and write buffer, where the controller starts writing, and when the buffer is exhausted, it writes to the native NAND Flash (MLC / TLC / QLC).
Using IOmeter, we can get an idea of the SLC cache volume of this SSD, as manufacturers often do not provide this information. From the tests we conducted, we were able to determine that it has a dynamic pSLC cache of about 109GB, where it managed to maintain an average speed of ~9930MB/s until the buffer was exhausted.
After it finishes writing in the pSLC cache region, it continues writing in the native TLC region for approximately 741GB at an average speed above 2.2 GB/s.
Then, after finishing writing to its native region, the SSD enters the Folding / Copyback state, where it reprograms the pSLC blocks back to TLC. It continues writing at an average speed of 1056 MB/s until the entire drive is filled. These speeds are incredible for a 1TB SSD.
Its overall average speed, considering both the Native and Folding regions, is about 1894 MB/s, and as we can see in the chart below, this is extremely high, even surpassing the Crucial T700 that we tested.
We also conducted a test to measure how long it would take for the SSD to recover part of its buffer. During our testing session, which lasted from 30 seconds to 2 hours in idle, we compared using TRIM and garbage collection (GC) versus not using TRIM/GC. When testing without using TRIM/GC, we observed that, as expected from Phison controllers, it did not recover anything without TRIM being used.


However, when testing with TRIM/GC enabled, it was able to recover its full volume in just a few seconds.
FILE COPY TEST
In this test, we copied the ISO files and the CSGO folder from a RAM disk to the SSD to see how it performs. The Windows 10 21H1 ISO of 6.25GB (1 file) was used, along with the CSGO installation folder of 25.2GB.


During our file copy testing sessions, we observed that with very small files, the difference between the SSDs is so small that we couldn’t even distinguish them. Only as we increased the file size did we begin to notice a slight difference between the SSDs, but it was still very minimal—nothing that would impact the user’s experience.
TEMPERATURE STRESS TEST
In this section of the analysis, we will observe the temperature of the SSD during a stress test, where the SSD continuously receives files. This will allow us to determine if there was any thermal throttling of its internal components that could cause a bottleneck or performance loss.
In this project, the SSD is programmed to undergo thermal throttling between 87°C and 89°C, and this indeed happens, as the controller needs to protect itself due to its high power consumption, which we will discuss shortly.
In this test, we ran it in two ways: with the SSD “bare” without any heatsink and with the robust Dark AirFlow I. Through its sensors, which proved to be quite accurate, we observed a huge difference of over 40°C. Yes, you read that correctly—temperatures dropped almost by half thanks to the Dark AirFlow I!
Obviously, not everything is perfect. Although the heatsink is extremely effective, it is quite large, which could cause compatibility issues with some motherboards. For example, on my Z790, I had to use M.2 to PCIe adapters since it literally blocked access to the PCIe 4.0 x4 slot below the PCIe 5.0 x16 slot of the graphics card where the SSD was installed. Additionally, the fan, due to its high rotation speed, generates some noise, so adjusting it via PWM could be a good option.
As we can see in the short video above from the thermal images of this SSD, it gives the impression that the controller is not heating up due to the color of the image. However, this is incorrect.
This happens because the material that coats the controller does not emit its own thermal radiation significantly due to its low emissivity, which is the ability of a material to emit thermal radiation. Materials like glass and other reflective surfaces have this characteristic.
POWER AND EFFICIENCY
SSDs, like many other components in our system, have a specific power consumption. The most efficient ones can perform requested tasks quickly and with relatively low power consumption, allowing them to transition back to their idle power states, where they tend to consume less energy.
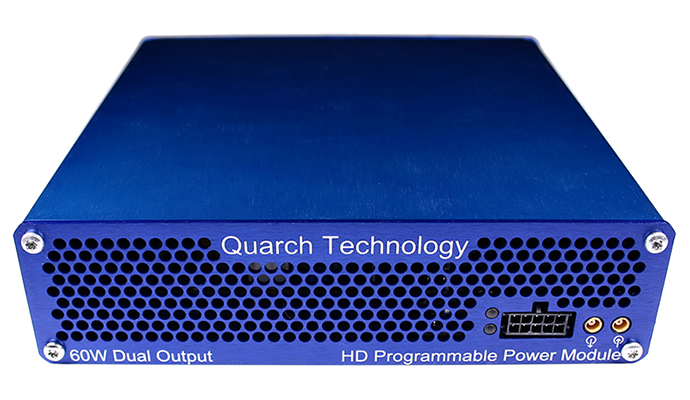
In this section of the analysis, we will use the Quarch Programmable Power Module, which was sent to us by Quarch Solutions (see photo above), to conduct these tests and assess the SSD’s efficiency. This methodology will involve three tests: the maximum power consumption of the SSD, an average in practical and casual scenarios, and idle consumption.
This test setup, especially the efficiency and idle tests, is particularly important for users who plan to use drives in laptops, as SSDs spend the vast majority of their time in low-power states (Idle). Therefore, this helps significantly with battery savings.
As expected from its efficiency, we again encounter another extremely fast Gen5 SSD, but with low efficiency.
Once again, as we saw with the T700, these SSDs with the Phison E26 + Micron B58R combination are excellent in terms of performance but terrible when it comes to efficiency. We can see this here with its maximum consumption of over 10.3W.
During our benchmark, the Z540 managed to have a consumption almost 600mW lower than the T700. However, due to its SLC cache being smaller than the size of our benchmark, it spent the majority of the benchmark working in its native TLC speeds, which significantly impacted its efficiency.
Lastly, and most importantly, the idle test, which is the scenario where the vast majority of SSDs operate in everyday use, is one of the worst points to comment on for these Phison controllers. Their idle consumption, even with the SSD being idle and with no partition created, is extremely high. To give you an idea, the consumption is so high that an SSD with MAP1602 + YMTC TLC can have an average even lower than this value.
CONCLUSION
Is the extra investment in this model really worth it?
First and foremost, we cannot overlook the fact that this is indeed one of the fastest SSDs on the planet. However, speed isn’t everything, and while it doesn’t fall short in any aspect of performance, there are two key points that are crucial for determining if it’s truly worth the investment.
The first is its cost. It is obvious that as a Gen5 SSD, it comes at a higher price than a Gen4 SSD. But the problem is that the cost of Gen5 SSDs is unfeasible. While a 1TB Gen5 SSD might cost over $150, in this price range, we can purchase top-of-the-line Gen4 SSDs with 2TB of capacity, often even with DRAM Cache—this is double the capacity of a Gen5.
Another issue is its low efficiency and high consumption, which contributes to the fact that Gen5 SSDs tend to heat up a lot, requiring increasingly robust heatsinks to operate effectively.
PROs
- Excellent sequential speeds
- Excellent random speeds
- Very good performance in practical and professional scenarios
- No hardware variation
- Excellent build quality, great controller, and great NANDs
- The separately sold heatsink is very efficient
- Great-sized SLC Cache
- Excellent sustained write speed
- Basic software from Teamgroup
- Durability (TBW) on par with other SSDs
- 5-year warranty
CONs
- Suffers severe thermal throttling, potentially dropping to around 100 MB/s
- The separately sold heatsink makes quite a bit of noise at maximum rotation
- SLC Cache takes a bit to recover
- SSD gets very hot
- Does not have encryption
- High price
- Low energy efficiency, high consumption in idle and lighter workloads
